A Failed Test of the 200 DMA and Now, Set for a Sell-off !
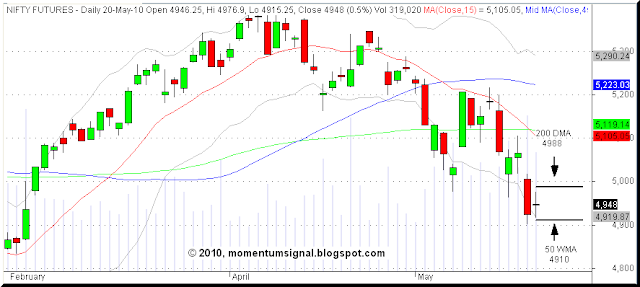
The Nifty futures opened with some positive bias at 4946 and traded lower in the initial hour to reach the Wednesday's closing value . Later, it tried to test the 200 DMA as anticipated in the last post and reached the high of 4977. It sold off again to reach a low of 4915 which also coincides with the 50 WMA as pointed out in the last posts. The futures closed at 4948 with some gains.
The important point now is that it has closed below the 200 DMA for two days and the test of the DMA has failed. Now it is set for another sell off. The next support for the futures are at the 4675 - 4700 levels which coincides with the February 2010 lows and the August 2009 highs.
Nifty Futures - Daily Chart
World Markets
Even though the European markets were trading with gains when the Indian markets closed, those markets closed with losses on Thursday. The US market has joined the sell off with the US indices falling as much as 5 to 6 percent intraday. At 11.55 PM IST the US indices were trading with losses of 2 to 3 percent. The fear index, VIX, was trading at 46 at a new recent high.
The Updated Momentum Signal Spreadsheet
The updated spreadsheet showing the Momentum Signal as on the close of 21st May 2010, is given below.Projected Momentum Signal Close Values
Please click on the table to enlarge. For more info on the above table, please click here.
All short positions in the Nifty futures may be protected with trailing stops which may be calculated by adding 2.1 to 2.5 % with the new low. The absolute stop is at 4904 as given in the last post.
Please do write in your suggestions and comments about this blog.
Cheers and Prosperous Investing and Trading !!!
To access the free online Position Limit Calculator click here.
To checkout the five year history of The Momentum Signal Spreadsheet click here.
To checkout the five year history of The Momentum Signal Spreadsheet click here.
© 2010 momentumsignal.blogspot.com All rights reserved.
Disclaimer: No research, information or content contained herein or in the accompanied spreadsheet shall be construed as advice and is offered for information purposes only. We shall not be responsible and disclaim any liability for any loss, liability, damage (whether direct or consequential) or expense of any nature whatsoever which may be suffered by the user or any third party as a result of or which may be attributable, directly or indirectly, to the use of or reliance on any information or service provided. All files/information is provided 'as is' with no warranty or guarantee as to its reliability or accuracy.


No comments:
Post a Comment