google.com, pub-7808368332557457, DIRECT, f08c47fec0942fa0 The Ultimate Momentum Signal: 05/01/2010 - 06/01/2010

Monday, May 31, 2010

Update on The Ultimate Momentum Signal - 31st May, 2010

   The Million Dollar Question .. ?

Is the current uptrend a real rally or just short covering ? Last week, on each trading day, the Nifty futures traded at a range which was completely different from the previous day's range. In markets like these any kind of prediction or any trading system becomes a bit suspect. As pointed out in one of the previous posts, decreasing the size of the trades seems to be an ideal solution to decrease the risk of trading. The higher volatility will either provide the higher profit or loss on a small sized position.

 Nifty Futures - Daily Chart


Ordinarily, a market which is rallying, trades in smaller ranges. An exception to this rule is  the start of a fast and furious  short covering rally. The covering rally has happened on the last three trading days and now the Nifty futures may need to correct somewhat before trying to test the resistances just above the present trading range.   A test of the resistances after a small correction for a day or two is the best case scenario at present. ( Please see the various resistances in the chart above. ) However, a further deterioration of the ongoing European debt crisis may again land the futures in to a correction. 

World Markets

The European markets were trading positively when the Indian markets closed on Friday. However, they lost all their gains and closed with small losses on Friday. The US markets traded lower to neutral and finished lower with losses of a percent after a volatile session. Meanwhile, the credit rating of Spain was lowered by a notch on Friday. There were even speculation of a rating cut of France in the future.

The Updated Momentum Signal Spreadsheet

The updated spreadsheet showing the Momentum Signal as on the close of  28th May 2010, is given below.
 
 
The Momentum Signal has indicated a buy with +50 value as on the close of trading on Friday.

Projected Momentum Signal Close Values

The projected levels of closing values corresponding to the momentum shift / neutrality / continuation as on the close of trading on 31st May, 2010 are given in the table below. The table also include the projected closing values of BSE Sensex corresponding to the momentum shift / neutrality / continuation signals.


  Please click on the table to enlarge. For more info on the above table,  please click here.

Even though the Momentum Signal System has indicated a buy, traders may remain cautious and  reduce the position limit/size of the trades for the reasons explained in the first paragraph. Experience has shown that  the system is more suitable to markets with low volatility trading. Please also read the risk factors page of this blog.


Cheers and Prosperous Investing and Trading !!!


© 2010 momentumsignal.blogspot.com All rights reserved.

Disclaimer: No research, information or content contained herein or in the accompanied spreadsheet shall be construed as advice and is offered for information purposes only. We shall not be responsible and disclaim any liability for any loss, liability, damage (whether direct or consequential) or expense of any nature whatsoever which may be suffered by the user or any third party as a result of or which may be attributable, directly or indirectly, to the use of or reliance on any information or service provided. All files/information is provided 'as is' with no warranty or guarantee as to its reliability or accuracy.

Sunday, May 30, 2010

Nifty Heavies Revisited .. !

 Nifty Futures

Nifty futures had a roller coaster ride last week. From a high of 5023 on Monday,  it recorded a low of 4786 on Tuesday. It gained on the last three days of the week to reach a high of 5055 on Friday. It closed at 5037 for the week. As the trading has been entirely based on international cues, any prediction has become useless. Therefore, lets try to understand what the market has done and why. 

The Indian market has been able to reasonably withstand the the onslaught of the bears recently unlike in the past. In the past, our market used to be more volatile than it's western counterparts. The reason for this positioning is none other than the better macro economic growth story offered by the Indian economy. However, any further deterioration of the  European soveriegn debt debacle may still affect our markets. 

Nifty Weekly & Weekly Moving Averages Chart  


The Nifty future is supported by the 50 WMA at 4918. The Nifty futures is still trading below its short term  weekly moving averages. The 5, 10 and 20 week moving averages are at 5065, 5186 and 5092 respectively. These short term averages may act as resistances.

Nifty Heavy Weights

The top ten members of the S&P Nifty index and their prices and various daily moving averages are given in the table below.    


Reliance


The most important Nifty constituent, Reliance is still trading  sideways even after the favourable court verdict. The stock is still trading very near to it's 200 DMA. The trading range remains confined to the 975 to 1100 range. 

Infosys


Even though Infosys stock has been correcting from the April highs, there has not been any damage to it's charts. it remains one of the strong pivotals.

ICICI Bank


After the somewhat disappointing results announced by the ICICI Bank, the stock has corrected and the out-performance has been lost. The stock is trading around the 200 DMA at 865.

Larsen & Tubro


After the declaration of the better than expected results, the LT stock has regained performance. It has started  showing higher strength  in the weak market. The stock is trading above it's short and  long term moving averages.

ITC


ITC declared good results and has broken out of it's consolidating pattern. ITC is one of the rare stocks which is trading at a new high at present. The stock may be bought on correction at around it's breakout level of just above the 270 level. The stock is trading above it's major moving averages.

HDFC  


HDFC stock has stood without much damage in the present correction. This stock is also trading above it's major moving averages.

HDFC Bank


HDFC Bank has been one of the out-performers which corrected recently. It reached it's previous high area of 1800 - 1830 area and has traded upwards. However, the stock is still trading below it's 50 DMA at 1918.

SBI 


SBI stock has withstood the correction even after declaring below the expectations results. May be the sovereign backing  of the bank is helping it in these uncertain times. 

ONGC


The ONGC stock which has been on a correction mode for some time has been the new surprise entry to the top ten heavy weights. The natural gas price hike by the government has been the reason for the stock's strength. However, the rally may strengthen only after it closes steadily above it's 200 DMA at 1135.

TCS


TCS stock has corrected and taken support at the 200 DMA at 693. It may have resistances at the 100 and 50 DMAs at 770 - 780 levels. These moving averages acted as it's support earlier.

Cheers and Prosperous Investing !!!


© 2010 momentumsignal.blogspot.com All rights reserved.

Disclaimer: No research, information or content contained herein or in the accompanied spreadsheet shall be construed as advice and is offered for information purposes only. We shall not be responsible and disclaim any liability for any loss, liability, damage (whether direct or consequential) or expense of any nature whatsoever which may be suffered by the user or any third party as a result of or which may be attributable, directly or indirectly, to the use of or reliance on any information or service provided. All files/information is provided 'as is' with no warranty or guarantee as to its reliability or accuracy.

Thursday, May 27, 2010

Update on The Ultimate Momentum Signal - 28th May, 2010

  Is It a Relief Rally or the Real  One .. ?

Some Pointers :
  • China expresses that it will remain as a long term investor in Europe, leading to a rally in all securities.
  • Equities, sovereign bonds and commodities gain.
  • The Euro currency too stages a bounce from the four year lows.
  • More European countries plan or authorise more budget cuts.
  • Optimism prevails in all the markets, at least for the day.

Stocks rallied all over the world on Thursday.  The European indices, the FTSE, CAC and the DAX gained 3.1, 3.4 and 3.1 % respectively. The US market indices were trading with gains of 2 to 2.9 % at the time of this post at 11.30 PM IST. The US VIX index has also fallen and was trading at 30.33.

Nifty Futures 

The Nifty futures took it's cues from the international markets and rallied strongly on the derivative settlement day on Thursday. However the June month futures were quoting at a discount of 19 points on the basis of the last traded prices. Meanwhile, the May month Nifty Futures closed at 5004, just above the 200 DMA at 4995. It is felt that some more steam is left in the rally. The momentum Signal system has indicated the end of the down trend. The closing levels required for the continuation of the down trend have decreased and are below the last traded prices.   

    Nifty Futures - Daily  Chart 


The Updated Momentum Signal Spreadsheet

The updated spreadsheet showing the Momentum Signal as on the close of  27th May 2010, is given below.


The Momentum Signal has indicated neutral value as on the close of trading on Thursday. 


Projected Momentum Signal Close Values

The projected levels of closing values corresponding to the momentum shift / neutrality / continuation as on the close of trading on 28th May, 2010 are given in the table below. The table also include the projected closing values of BSE Sensex corresponding to the momentum shift / neutrality / continuation signals.

  Please click on the table to enlarge. For more info on the above table,  please click here.

The closing values required for the resumption of the down trend have decreased significantly and  are reasonably away from the last traded prices. The neutral area has also shrunk significantly thereby increasing the probability of indicating a buy signal as on the closing as on 28th May, 2010.

Cheers and Prosperous Investing and Trading !!!


© 2010 momentumsignal.blogspot.com All rights reserved.

Disclaimer: No research, information or content contained herein or in the accompanied spreadsheet shall be construed as advice and is offered for information purposes only. We shall not be responsible and disclaim any liability for any loss, liability, damage (whether direct or consequential) or expense of any nature whatsoever which may be suffered by the user or any third party as a result of or which may be attributable, directly or indirectly, to the use of or reliance on any information or service provided. All files/information is provided 'as is' with no warranty or guarantee as to its reliability or accuracy.

Update on The Ultimate Momentum Signal - 27th May, 2010

    The International Markets, ( Read the US Markets ) Reigns .. !

The US markets opened with deep losses on Tuesday and recovered most of the losses by the time the trading ended. Therefore, all the markets including the Indian market gained on Wednesday. As the Nifty futures is trading all over the place in accordance with the whims and fancies of the international markets  position trading has become more difficult now a days. 

However, there is a way to reduce the trading risk in such markets. Traders may reduce the Position Limits to decrease the risk in such markets. A trade which turns out to be a correct one may still generate good returns because of the higher volatility.

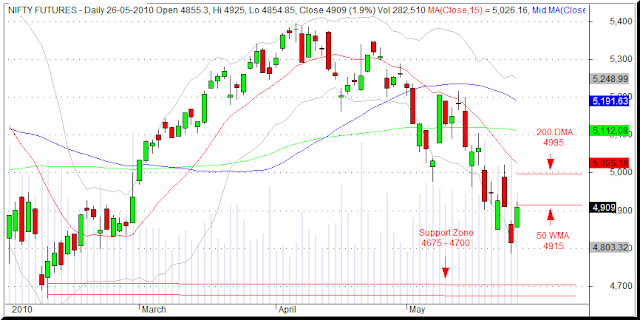
    Nifty Futures - Daily  Chart 


The Nifty futures is still trading below the 50 week moving average (WMA) placed at 4915. The 200 DMA is at 4995.

World Markets 

The European markets closed with gains of around 2 % each, even though they were off from their daily highs. The US indices were trading with gains of 0.5 to 1 % at the time of this post.

The Updated Momentum Signal Spreadsheet

The updated spreadsheet showing the Momentum Signal as on the close of  26th May 2010, is given below.


The Momentum Signal has returned a -100 value for the consecutive eighth day. 

Projected Momentum Signal Close Values

The projected levels of closing values corresponding to the momentum shift / neutrality / continuation as on the close of trading on 27th May, 2010 are given in the table below. The table also include the projected closing values of BSE Sensex corresponding to the momentum shift / neutrality / continuation signals.

     Please click on the table to enlarge. For more info on the above table,  please click here.
 
Due to the computer system failure and some personal exigencies, the daily updates will be  very short  for the time being. I hope to provide the updates of the Momentum Signal System uninterrupted.

Cheers and Prosperous Investing and Trading !!!
 
 
© 2010 momentumsignal.blogspot.com All rights reserved.

Disclaimer: No research, information or content contained herein or in the accompanied spreadsheet shall be construed as advice and is offered for information purposes only. We shall not be responsible and disclaim any liability for any loss, liability, damage (whether direct or consequential) or expense of any nature whatsoever which may be suffered by the user or any third party as a result of or which may be attributable, directly or indirectly, to the use of or reliance on any information or service provided. All files/information is provided 'as is' with no warranty or guarantee as to its reliability or accuracy.

Tuesday, May 25, 2010

Update on The Ultimate Momentum Signal - 26th May, 2010

   The Risk Perception Heightens ... !

Some Pointers

  • Tension increases in the Korean peninsula, which may harm the only growth story in the world, the Asian story.
  • IMF asks Spain to overhaul it's financial institutions.
  • Spanish bank regulators urges the weak banks to merge with the strong ones.
  • Three month USD Libor ( London Interbank Overnight Rate ) rate reaches the highest in eight months, indicating the Banks' reluctance to lend to other Banks.
  • CDS (Credit Default Swap) rates hits a new recent high.
  • The fear of the contagion is at a new high.
 Nifty Futures
Nifty Futures opened lower with a gap and never recovered on Tuesday. It traded mostly sideways till the European markets opened at 12.30 PM and thereafter sold off to record a low of 4786. However, it recovered some of the losses and finally closed at 4816.


As pointed out in some of the earlier posts, the next support zone for the Nifty futures is at the 4675 to 4700 area which corresponds to the lows of February,  2010.


The Updated Momentum Signal Spreadsheet

The updated spreadsheet showing the Momentum Signal as on the close of  25th May 2010, is given below.

The Momentum Signal has returned a value of  -100 for the seventh consecutive day.


Projected Momentum Signal Close Values

The projected levels of closing values corresponding to the momentum shift / neutrality / continuation as on the close of trading on 26th May, 2010 are given in the table below. The table also include the projected closing values of BSE Sensex corresponding to the momentum shift / neutrality / continuation signals.


    Please click on the table to enlarge. For more info on the above table,  please click here.


All short positions in the Nifty futures may be protected with trailing stops which may be calculated by adding 2.1 to 2.5 % with the new low. 


Due to the computer system failure and some personal exigencies, the daily updates will be  very short  for the time being. I hope to provide the updates of the Momentum Signal System uninterrupted.


Cheers and Prosperous Investing and Trading !!!
 
© 2010 momentumsignal.blogspot.com All rights reserved.

Disclaimer: No research, information or content contained herein or in the accompanied spreadsheet shall be construed as advice and is offered for information purposes only. We shall not be responsible and disclaim any liability for any loss, liability, damage (whether direct or consequential) or expense of any nature whatsoever which may be suffered by the user or any third party as a result of or which may be attributable, directly or indirectly, to the use of or reliance on any information or service provided. All files/information is provided 'as is' with no warranty or guarantee as to its reliability or accuracy.

Monday, May 24, 2010

Update on The Ultimate Momentum Signal - 25th May, 2010

Nifty Futures - Daily  Chart 


The Updated Momentum Signal Spreadsheet

The updated spreadsheet showing the Momentum Signal as on the close of 24th May 2010, is given below.


The Momentum Signal has returned a value of  -100 for the sixth consecutive day.


Projected Momentum Signal Close Values

The projected levels of closing values corresponding to the momentum shift / neutrality / continuation as on the close of trading on 25th May, 2010 are given in the table below. The table also include the projected closing values of BSE Sensex corresponding to the momentum shift / neutrality / continuation signals.


Due to a complete system failure experienced over the weekend,  only the basic minimum update of the Momentum Signal system is being provided for the time being. Traders are requested to note that the rules of the system are already available elsewhere on this blog.

Please do write in your suggestions and comments about this blog.

Cheers and Prosperous Investing and Trading !!!
 

© 2010 momentumsignal.blogspot.com All rights reserved.

Disclaimer: No research, information or content contained herein or in the accompanied spreadsheet shall be construed as advice and is offered for information purposes only. We shall not be responsible and disclaim any liability for any loss, liability, damage (whether direct or consequential) or expense of any nature whatsoever which may be suffered by the user or any third party as a result of or which may be attributable, directly or indirectly, to the use of or reliance on any information or service provided. All files/information is provided 'as is' with no warranty or guarantee as to its reliability or accuracy.

Update on The Ultimate Momentum Signal - 24th May, 2010

The Updated Momentum Signal Spreadsheet


The updated spreadsheet showing the Momentum Signal as on the close of 21st May 2010, is given below.


Projected Momentum Signal Close Values


The projected levels of closing values corresponding to the momentum shift / neutrality / continuation as on the close of trading on 24th May, 2010 are given in the table below. The table also include the projected closing values of BSE Sensex corresponding to the momentum shift / neutrality / continuation signals.


Even though this blogger had written to 'expect the unexpected' in the Risk Analysis page, the unexpected happened during the weekend. My main system and the backup failed due to different reasons and I am forced to depend on outside systems for the time being. I intend to provide the basic minimum updates of the trading system  without failure. Therefore, this shortened  and late update. The inconvenience is regretted.  

Please do write in your suggestions and comments about this blog.

Cheers and Prosperous Investing and Trading !!!


© 2010, momentumsignal.blogspot.com

All rights reserved. Disclaimer: No research, information or content contained herein or in the accompanied spreadsheet shall be construed as advice and is offered for information purposes only. We shall not be responsible and disclaim any liability for any loss, liability, damage (whether direct or consequential) or expense of any nature whatsoever which may be suffered by the user or any third party as a result of or which may be attributable, directly or indirectly, to the use of or reliance on any information or service provided. All files/information is provided 'as is' with no warranty or guarantee as to its reliability or accuracy.

Friday, May 21, 2010

Update on The Ultimate Momentum Signal - 21st May, 2010

  A Failed Test of the 200 DMA and Now, Set for a Sell-off  !

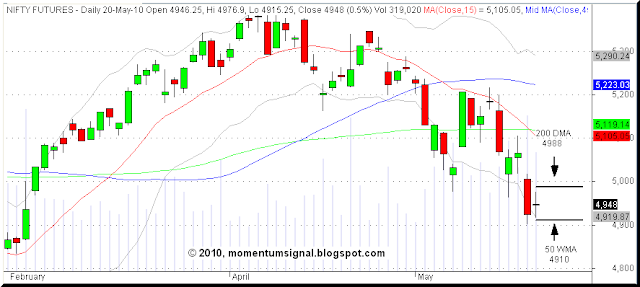
The Nifty futures opened with some positive bias at 4946 and  traded lower in the initial hour to reach the Wednesday's  closing value . Later, it tried to test the 200 DMA as anticipated in the last post and reached the high of 4977. It sold off again to reach a low of 4915 which also  coincides with the 50 WMA as pointed out in the last posts. The futures closed at 4948 with some gains. 

The important point now is that it has closed below the 200 DMA for two days and the test of the DMA has failed. Now it is set for another sell off. The next support for the futures are at the 4675 - 4700 levels which coincides with the February 2010 lows and the August 2009 highs.

Nifty Futures - Daily  Chart 


World Markets 

Even though the European markets were trading with gains when the Indian markets closed, those markets closed with losses on Thursday. The US market has joined the sell off with the US indices falling as much as 5 to 6 percent intraday. At 11.55 PM IST the US indices were trading with losses of 2 to 3 percent. The fear index, VIX, was trading at 46 at a new recent high.

The Updated Momentum Signal Spreadsheet

The updated spreadsheet showing the Momentum Signal as on the close of  21st May 2010, is given below.


Projected Momentum Signal Close Values

The projected levels of closing values corresponding to the momentum shift / neutrality / continuation as on the close of trading on 21st May, 2010 are given in the table below. The table also include the projected closing values of BSE Sensex corresponding to the momentum shift / neutrality / continuation signals.
 
 
    Please click on the table to enlarge. For more info on the above table,  please click here.

All short positions in the Nifty futures may be protected with trailing stops which may be calculated by adding 2.1 to 2.5 % with the new low. The absolute stop is at 4904 as given in the last post.
Please do write in your suggestions and comments about this blog.

Cheers and Prosperous Investing and Trading !!!
 

© 2010 momentumsignal.blogspot.com All rights reserved.

Disclaimer: No research, information or content contained herein or in the accompanied spreadsheet shall be construed as advice and is offered for information purposes only. We shall not be responsible and disclaim any liability for any loss, liability, damage (whether direct or consequential) or expense of any nature whatsoever which may be suffered by the user or any third party as a result of or which may be attributable, directly or indirectly, to the use of or reliance on any information or service provided. All files/information is provided 'as is' with no warranty or guarantee as to its reliability or accuracy.

Thursday, May 20, 2010

Update on The Ultimate Momentum Signal - 20th May, 2010

  The Breakdown At Last, But What is Next ... !

The Nifty futures opened lower at 5006 due to the overnight negative cues originating from the US markets  and traded flat in the initial hours. It also tried to trade higher, but could only reach the low of the previous day's range at 5019. As it could not sustain the higher reaches, it traded lower in tandem with the European markets. It even broke the 200 DMA at 5085 and traded to a low of  4901. The fututres closed at 4925 for the day. The futures have some support at the 4900 - 4910 area from the 50 week moving average at 4910. This was also pointed out in the post dated 18th May, 2010. The next support for the futures are at the 4675 - 4700 levels which are the February 2010 lows.

It was on the third attempt that the futures broke the 200 DMA zone. The earlier two attempts were made on 7th  and 17th of May respectively. Readers might be wondering why this is mentioned here  at all ! There is a reason ! Experience has shown that the third attempt to test a significant resistance or support has a higher probability of succeeding.  Well there is no proof for this ! But this is an observation which may be useful.

S&P Nifty Index - Daily Chart 


Instead of the customary Nifty futures chart, today's chart is of the index. But all levels marked are applicable to the futures. As the futures have broken the 200 DMA and closed below it, now let us check what could be the next course. When a market undergoes a breakout or breakdown, sometimes, the significant level which has just been passed is retested. This retest could be either immediate or be a bit late. In case of retest, traders may watch for the 4985 level which is the 200 DMA as well as the low of the first test. 

World Markets

The German short selling ban, which was also reported  in the last post, affected the European markets negatively and the FTSE, DAX and the CAC closed with losses of 2.5, 2.6 and 2.9 percents respectively on Wednesday. The US market indices were trading with losses of a percent each at the time of this post ( 00 Hours IST ). Earlier in the day the US S&P 500 index had bounced from it's 200 DMA at  1101. The VIX index was trading at 35 increasing 5 % from the previous day.

The Updated Momentum Signal Spreadsheet

The updated spreadsheet showing the Momentum Signal as on the close of  19th May 2010, is given below.


The Momentum Signal has returned -100 values for the third day in succession.

Projected Momentum Signal Close Values

The projected levels of closing values corresponding to the momentum shift / neutrality / continuation as on the close of trading on 20th May, 2010 are given in the table below. The table also include the projected closing values of BSE Sensex corresponding to the momentum shift / neutrality / continuation signals.

   Please click on the table to enlarge. For more info on the above table,  please click here.
   
The neutral areas are placed just above the 200 DMA levels. The positive trigger values have increased too.

The trailing stop is placed at the 5004 level ( Low 4901 + 2.1 % ).
Please do write in your suggestions and comments about this blog.

Cheers and Prosperous Investing and Trading!!!

© 2010 momentumsignal.blogspot.com All rights reserved.

Disclaimer: No research, information or content contained herein or in the accompanied spreadsheet shall be construed as advice and is offered for information purposes only. We shall not be responsible and disclaim any liability for any loss, liability, damage (whether direct or consequential) or expense of any nature whatsoever which may be suffered by the user or any third party as a result of or which may be attributable, directly or indirectly, to the use of or reliance on any information or service provided. All files/information is provided 'as is' with no warranty or guarantee as to its reliability or accuracy.

Tuesday, May 18, 2010

Update on The Ultimate Momentum Signal - 19th May, 2010

 A Day of Directionless Trading,  But What is Next ... !

Even though the last post had reported that the US markets were trading with losses of 1.25 %, the markets recovered  and closed without any losses overnight. Therefore, the Nifty futures opened with neutral international cues and traded lower to reach a low of 5017 in the first hour. The futures recovered later  and achieved a high of 5108 by 1.30 PM. The day's high of 5108 may also be treated as a  ( failed ? ) test of the 100 DMA at 5120. The day's trading ended at 5065 on a flat note.   The technical position of the market has not changed by the day's trading. The major question now is: Is the market becoming a range bound one ? Readers of this blog are requested to take note that the Momentum Signal System's signals may lead to whipsaws in a range bound market.
Nifty Futures - Daily & DMAs Chart 

For more analysis please take a look at the previous post too.  However, it is felt that a specific comment need to be made about the present day Indian Market. The Indian Market,  normally a high beta one, is holding up remarkably well on the face of  the high volatility seen in the international markets. The Indian markets used to have higher volatility than the western markets in the past.

World Markets

Due to the late recovery of the US markets on Monday, the European markets gained on Tuesday. The FTSE, DAX and the CAC closed with gains of 0.85, 1.5 and 2.1 % respectively on Tuesday.  The FTSE also closed just above it's 200 DMA. However, the US market indices were trading with losses of 0.5 to 1.0 % at 11.30 PM IST on back of reports of a proposed ban of naked short selling to be imposed by the German authorities on Wednesday. The VIX index was hovering at 30.5 without much change.

The Updated Momentum Signal Spreadsheet

The updated spreadsheet showing the Momentum Signal as on the close of  18th May 2010, is given below.

The Momentum Signal has returned -100 values for the second day in succession.

Projected Momentum Signal Close Values

The projected levels of closing values corresponding to the momentum shift / neutrality / continuation as on the close of trading on 19th May, 2010 are given in the table below. The table also include the projected closing values of BSE Sensex corresponding to the momentum shift / neutrality / continuation signals.

   Please click on the table to enlarge. For more info on the above table,  please click here.

A close below the 5120 - 5130 levels is still bearish for the Nifty Futures. However, the triggers for an uptrend as per the Momentum Signal system have fallen and are placed at 5151 - 5155 levels.
Followers of this blog are requested to please read the Risk Factors  3 and 4, which may be applicable  to the present market conditions. Or please take note that the Momentum Signal System's signals may lead to whipsaws in a range bound market.

Please do write in your suggestions and comments about this blog.

Cheers and Prosperous Investing and Trading!!!


© 2010 momentumsignal.blogspot.com All rights reserved.

Disclaimer: No research, information or content contained herein or in the accompanied spreadsheet shall be construed as advice and is offered for information purposes only. We shall not be responsible and disclaim any liability for any loss, liability, damage (whether direct or consequential) or expense of any nature whatsoever which may be suffered by the user or any third party as a result of or which may be attributable, directly or indirectly, to the use of or reliance on any information or service provided. All files/information is provided 'as is' with no warranty or guarantee as to its reliability or accuracy.

Monday, May 17, 2010

Update on The Ultimate Momentum Signal - 18th May, 2010

Another Test of 200 DMA, But What is Next ... !
The Nifty futures opened lower at 5018 and as anticipated in the last post, tested the 200 DMA at 4975. The futures even traded to a low of 5062 and thereafter, it rallied in step with the European markets which opened with some mild losses and traded to the positive territory. ( Experience shows that even if the Nifty futures breaches any major support or resistance by  10 to 12 points, it is not a valid  signal for a winning trade.)  The future's daily high was almost identical to the last traded price of Friday at 5070. 

The Nifty futures have tested the 50 DMA  (presently placed at  the 5215- 5220  levels) and the 200 DMA (presently placed at the 4975 - 4980 levels) twice during the past seven trading days. The futures have reversed from these major moving averages twice too. The major question now is: Is the market becoming a range bound one ? As stated in the earlier posts, it seems that the  Nifty  future is moving on the basis of international cues  mostly, especially the cues from Europe and the US. As the direction of the markets is unclear now, traders may check whether the Nifty future is able to  cross the 100 DMA at 5120 convincingly on any rallies. In case the Nifty future is unable to cross the 100 DMA, it may breach the 200 DMA again. The the next support for the future, below the  200 DMA,  may be at the 50 week moving average (WMA) at 4910.
Nifty Futures - Daily & DMAs Chart 


World Markets

Even though the European markets were trading in the positive territory when the Indian markets closed, the FTSE and DAX closed flat on Monday. The CAC closed with a loss of half a percent. The US markets were trading lower with losses of 1.25 % at 11.15 PM IST, on the fears of the Euro zone crisis and  disappointing earnings outlooks. The fear index ( VIX Index ) was trading at 33 at the time of this post. The Euro USD pair was trading near the recent lows at 1.2298. 

The US market indices are also trading between their respective 200 and 100 DMAs on Monday like the Indian markets. In major international indices, the Nikkei, Shnaghai, Hangseng and  the FTSE  have closed below their 200 DMAs on Monday.

The Updated Momentum Signal Spreadsheet

The updated spreadsheet showing the Momentum Signal as on the close of  17th May 2010, is given below.
The Momentum Signal has returned -100 values indicating a sell as on 17th May, 2010.
Projected Momentum Signal Close Values

The projected levels of closing values corresponding to the momentum shift / neutrality / continuation as on the close of trading on 18th May, 2010 are given in the table below. The table also include the projected closing values of BSE Sensex corresponding to the momentum shift / neutrality / continuation signals.
   Please click on the table to enlarge. For more info on the above table,  please click here.

A close below the 5120 - 5130 levels is still bearish for the Nifty Futures. However, the triggers for an uptrend as per the Momentum Signal system have fallen and are placed at 5140 - 5153 levels. It is also noted that the neutral area has shrunk to very minimal points. May be a major move is around the corner which may 'make it or break it'.


Followers of this blog are requested to please read the Risk Factors  3 and 4, which may be applicable  to the present market conditions.

Please do write in your suggestions and comments about this blog.

Cheers and Prosperous Investing and Trading!!!  


© 2010 momentumsignal.blogspot.com All rights reserved.

Disclaimer: No research, information or content contained herein or in the accompanied spreadsheet shall be construed as advice and is offered for information purposes only. We shall not be responsible and disclaim any liability for any loss, liability, damage (whether direct or consequential) or expense of any nature whatsoever which may be suffered by the user or any third party as a result of or which may be attributable, directly or indirectly, to the use of or reliance on any information or service provided. All files/information is provided 'as is' with no warranty or guarantee as to its reliability or accuracy.

Sunday, May 16, 2010

Update on The Ultimate Momentum Signal - 17th May, 2010

 Risk is in the Radar of Investors ... !

Last Friday, the Nifty futures opened near the Thursday's low and traded higher in the initial stages. It achieved the day's high of 5202 by 11 AM. However, very negative cues from the European markets ensured that the futures failed in it's test of the 50 DMA at 5220. The futures sold off even below the 100 DMA at 5120 and the then weekly low of 5080. It finally closed at 5069.

Even though the Momentum Signal had initiated a buy signal, the signal completely failed  this time. A trader who would have taken a long position would have made a loss of 103 points. In this connection please note that the previous post itself had raised certain doubts about the the market by pointing out  the formation of a doji candle and the directionless nature of the markets. In addition, it was stated that the market is totally dependent on international cues for further direction.

Nifty Futures - Daily & DMAs Chart    


The upper panel of the chart shows the formation of various doji candles just before the reversals in the recent past. It seems that such doji candles have more predictive power in markets which have more uncertainty and and are likely to trend down. The lower panel shows the various DMAs of the futures. The Nifty futures may test the 200 DMA at 2975 in the coming week. ( Please also read the previous post on Nifty Heavy Weights for more analysis. ) 

World Markets 

The European markets sold off further after the close of Indian markets on last Friday on the back of increased fears of a dissolution of the Euro currency and the possible contraction in the economies of the debt laden countries.The US market indices also closed with losses of 1.5 to 2%. However, the US markets were able to recover some of it's intraday losses before the close on Friday. The US indices  were trading near their 100 DMAs at the close. The CBOE VIX closed at 31,  much below the 41 levels it reached a week ago.

The Updated Momentum Signal Spreadsheet

The updated spreadsheet showing the Momentum Signal as on the close of  14th May 2010, is given below.


The Momentum Signal has returned neutral values as on 14th May, 2010.

Projected Momentum Signal Close Values

The projected levels of closing values corresponding to the momentum shift / neutrality / continuation as on the close of trading on 17th May, 2010 are given in the table below. The table also include the projected closing values of BSE Sensex corresponding to the momentum shift / neutrality / continuation signals.
   Please click on the table to enlarge. For more info on the above table,  please click here.
Any close below 5127 - 5132 levels  is bearish for the Nifty Futures and would indicate a sell signal.  Traders may please note that volatility is increasing at present and therefore the risk in trading may rise. 

Followers of this blog may please read the Risk Factors and the FAQs pages of this blog for more information.

Please do write in your suggestions and comments about this blog.

Cheers and Prosperous Investing and Trading!!!   


© 2010 momentumsignal.blogspot.com All rights reserved.

Disclaimer: No research, information or content contained herein or in the accompanied spreadsheet shall be construed as advice and is offered for information purposes only. We shall not be responsible and disclaim any liability for any loss, liability, damage (whether direct or consequential) or expense of any nature whatsoever which may be suffered by the user or any third party as a result of or which may be attributable, directly or indirectly, to the use of or reliance on any information or service provided. All files/information is provided 'as is' with no warranty or guarantee as to its reliability or accuracy.