google.com, pub-7808368332557457, DIRECT, f08c47fec0942fa0 The Ultimate Momentum Signal

Saturday, May 15, 2010

The Nifty Heavy Weights


  Nifty and It's Biggest Constituents

Last week was an eventful one for the markets. The Nifty futures actually closed with a gain of some 37 points. However, let's check out the real market action for the past week. The market opened higher on back of the shock and awe European bailout plan on Monday. On Tuesday, the markets tested the Monday's low of 5080 too. Therefore, the markets were expected to test the high of 5108 and the high was tested on Thursday. However, Friday's trading has proved that the markets have failed in its test of 5210 - 5220 range. The proof of the failure is that the futures traded lower and closed below 5080 which was the low on Monday. On the weekly charts, last week's action has lead to the formation of a shooting star or inverted hammer candle which indicates further weakness ahead. 

Nifty Futures - DMA & ATR Chart


The Nifty future has closed below it's 100 DMA for the second week in succession. It may test the 200 DMA at 2975 in the coming week. The 200 DMA also coincides with the future's previous low of 5076. The second panel in the chart above shows the various averages of the True Range of the futures in points. It can be observed from the chart that the TRs increase normally when the market falls and it decreases when the markets rally. The TR has started to increase and it is above it's long term averages at present.  Therefore, traders may expect higher volatility on a day to day basis.

Nifty Heavy Weights - Weightage, Close & DMAs


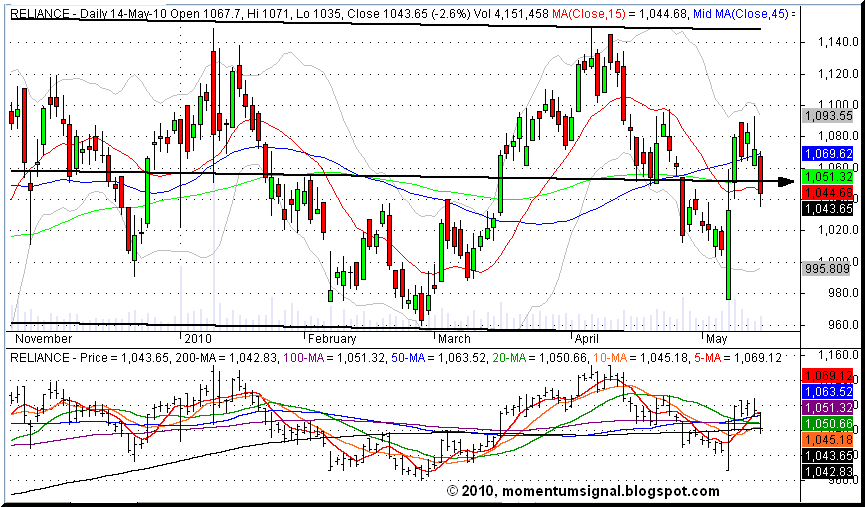
LT is trading below all of it's DMAs. Reliance and BHEL are trading below their short term DMAs but very near to their 200 DMAs. HDFCBANK, SBIN and TCS are still trading above their 200 DMAs by more than 10 %. INFOSYS, ICICIBANK, HDFC, and ITC are trading above their 200 DMAs less than 10 %. The out performance of these share are also slackening  which may be indicating technical weakness.

Today's edition includes the charts of all the Nifty heavies too. All charts include the price panel as well as the various DMAs panel. Please note that the price panel also includes the regression channel. The center line of the regression channel  shows the trading direction of the instrument for the selected period of the chart. These charts include the trading history of about six months.

Reliance - Daily & DMA Chart


Infosys - Daily & DMA Chart


ICICIBANK - Daily & DMA Chart


LT  - Daily & DMA Chart

 
HDFC - Daily & DMA Chart


ITC  - Daily & DMA Chart


HDFCBANK - Daily & DMA Chart


SBIN - Daily & DMA Chart


TCS  - Daily & DMA Chart


BHEL - Daily & DMA Chart


Here is the conclusion of this post which is quoted from the last Nifty Heavies edition !

"Since the present downtrend has multiple reasons and is spread all around the world, traders and investors may wait for some time to get some clear signals to go long on the market."

Cheers and Prosperous Investing !!!   


© 2010 momentumsignal.blogspot.com All rights reserved.

Disclaimer: No research, information or content contained herein or in the accompanied spreadsheet shall be construed as advice and is offered for information purposes only. We shall not be responsible and disclaim any liability for any loss, liability, damage (whether direct or consequential) or expense of any nature whatsoever which may be suffered by the user or any third party as a result of or which may be attributable, directly or indirectly, to the use of or reliance on any information or service provided. All files/information is provided 'as is' with no warranty or guarantee as to its reliability or accuracy.

Thursday, May 13, 2010

Update on The Ultimate Momentum Signal - 14th May, 2010

A Test of 50 DMA, A Doji Candle and A Buy Signal .. !

The Nifty futures opened with positive bias on Thursday and it almost tested the 50 DMA at 5120 by mid-day. ( This was also anticipated in the last post ). However, as it could not sustain the higher levels, it traded lower to reach 5165 and finally closed at 5183.20.  Nifty future's trading  on Thursday formed a doji candle, which indicates indecision or reversal. Meanwhile, the Momentum Signal returned a buy on the basis of the closing values of the Nifty futures and the BSE Sensex. The outcome of the buy signal depends on the cues from the international markets as the trading seems to be bit neutral and directionless at present. As indicated in the previous posts, the futures may get support  from the 100 DMA at 5120 and also from the weekly low of 5080. 

Nifty Futures - Daily Chart  


World Markets
Most Asian markets closed with gains on Thursday. In Europe too, the FTSE and the DAX  closed with gains of 0.93 % and 1.11 % respectively. The DAX index seems to be the best performer, may be on back of improved competitiveness of German companies due to the devaluation of the Euro currency. The Euro USD pair was trading at 1.2567 which is very near to the recent lows. However the French CAC closed with some negligible losses. The US market indices were trading with negligible losses of 0.1 to .04 % at the time of this post at 11.30 PM IST.

The Updated Momentum Signal Spreadsheet

The updated spreadsheet showing the Momentum Signal as on the close of  13th May 2010, is given below.
Momentum Signal has returned a value of +50 in respect of the Nifty futures but  it has returned  a neutral value in respect of the Nifty index. However, the close value of BSE Sensex  returned a Momentum Signal value of +50.

Projected Momentum Signal Close Values

The projected levels of closing values corresponding to the momentum shift / neutrality / continuation as on the close of trading on 14th May, 2010 are given in the table below. The table also include the projected closing values of BSE Sensex corresponding to the momentum shift / neutrality / continuation signals.
  Please click on the table to enlarge. For more info on the above table,  please click here.

The absolute stop loss for the long position signaled on Thursday remains 5080 which is the weekly low. This stop is approximately 2 % lower than the entry price of 5183. 
Followers of this blog may please read the Risk Factors and the FAQs pages of this blog for more information.

Please do write in your suggestions and comments about this blog.

Cheers and Prosperous Investing and Trading!!!   


© 2010, momentumsignal.blogspot.com All rights reserved.

Disclaimer: No research, information or content contained herein or in the accompanied spreadsheet shall be construed as advice and is offered for information purposes only. We shall not be responsible and disclaim any liability for any loss, liability, damage (whether direct or consequential) or expense of any nature whatsoever which may be suffered by the user or any third party as a result of or which may be attributable, directly or indirectly, to the use of or reliance on any information or service provided. All files/information is provided 'as is' with no warranty or guarantee as to its reliability or accuracy.