The Greek Tragedy - Act II and a Sell Signal... !
Following the turbulence in the world markets due to the ongoing sovereign debt crisis, the Nifty Futures opened lower at 5252 with a gap and reached a low of 5247 at the opening itself on Wednesday. Thereafter, it traded upwards and reached a high of 5277. However, it encountered selling from around 1.00 PM and reached a low of 5198 and finally closed at 5224. The Momentum Signal has indicated a sell as on the closing of Wednesday's trade.
Nifty Futures - Daily Chart

The present sell signal has come as a consequence of sudden news based fall and therefore, the market may try to recover. In case the markets goes in to a downtrend, the futures may get supports at the longer term daily moving averages ( DMAs ). The 50, 100 and 200 DMAs of the Futures are placed at 5156, 5113 and 4920 respectively.
Nifty Futures - Daily Moving Averages Chart

The most worrying factor about the S&P Nifty index is the weakness in the market heavyweight Reliance stock. Reliance lead the Wednesday's fall in the index. It fell 4 % and closed below even it's 200 DMA placed at 1037. ( See the chart below ).
Reliance Daily Chart & Moving Averages

The Updated Momentum Signal Spreadsheet
The updated spreadsheet showing the Momentum Signal as on the close of 28th April 2010, is given below.

The Momentum Signal has indicated a sell as on closing on Wednesday.
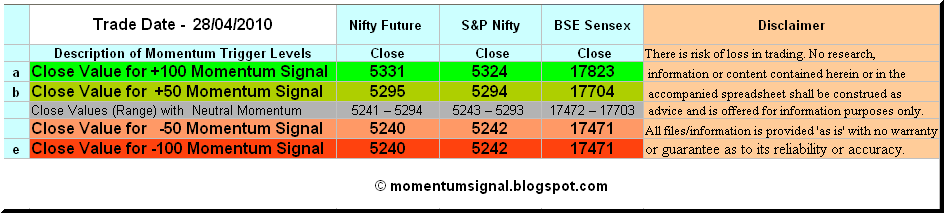
Projected Momentum Signal Close Values
The projected levels of closing values corresponding to the momentum shift / neutrality / continuation as on the close of trading on 29th April, 2010 are given in the table below. The table also include the projected closing values of BSE Sensex corresponding to the momentum shift / neutrality / continuation signals.

You can click on the table to enlarge. For more info on the above table, please click here.
Please do write in your suggestions and comments about this blog.
Cheers and Prosperous Investing and Trading!!!
You can use the free online Position Limit Calculator from here.
You can also checkout the five year history of The Momentum Signal Spreadsheet from here.
You can also checkout the five year history of The Momentum Signal Spreadsheet from here.
© 2010 momentumsignal.blogspot.com All rights reserved.
Disclaimer: No research, information or content contained herein or in the accompanied spreadsheet shall be construed as advice and is offered for information purposes only. We shall not be responsible and disclaim any liability for any loss, liability, damage (whether direct or consequential) or expense of any nature whatsoever which may be suffered by the user or any third party as a result of or which may be attributable, directly or indirectly, to the use of or reliance on any information or service provided. All files/information is provided 'as is' with no warranty or guarantee as to its reliability or accuracy.