The Futures Ends Lower In The Neutral Territory...!
The Greek Tragedy - Act II ... ?
The Greek Tragedy - Act II ... ?
The Nifty Futures opened lower at 5304.80 following the weak cues from the Asian markets and traded higher in the initial hours on Tuesday. It achieved a high of 5333.90 and thereafter traded lower to close at 5307.60. This possibility of a lower closing in the neutral territory was pointed out in the last post. Tuesday's range was also confined to a meager 35 points. The Futures are still trading in the new upward moving regression channel. Please see the support and resistance lines from the chart below. Even though this blog was expecting a higher closing on Thursday's derivative expiry, that possibility may be negated by the new developments in the sovereign the debt crisis. We may expect a lower open for the markets on Wednesday.
Nifty Futures - Daily Chart

World Markets
Even though the Asian markets traded significantly higher on Monday, barring the Nikkei index of Japan, most Asian indices closed with significant losses on Tuesday. Meanwhile, the fears over the sovereign debt crisis has significantly increased in Europe following the cut in the credit rating of Greece to junk status by the Standard and Poors rating agency. The Greek bond spreads have hit new highs indicating higher risk perception by the investors. (The spread or Risk Premium is the difference in the interest yield between two bonds of similar maturity ). Credit default swap rate for Greek debts has also hit new highs. Raising the risk of a contagion, the risk premium on Portuguese bonds also rose to more than double the past year’s average this month. Portugal’s credit default swaps show investors rank its debt as the world’s eighth-riskiest, worse than for Lebanon and Guatemala. As a consequence the FTSE ( -2.6% ) , CAC ( -3.82 % ) and DAX ( -2.7 % ) closed with significant losses in Europe.


European Indices - FTSE & DAX Daily Charts

The US markets were also trading with losses following the rating cut by the S&P rating agency even though housing prices have recorded an uptick for the first time in the last three years. At the time of writing this post ( 10.30 PM IST ) the VIX index showing the implied volatility of S&P 500 options has also spiked ( see the chart below ) indicating higher risk perception by the investors.
US Markets S & P 500 Index and CBOE VIX Index

The Updated Momentum Signal Spreadsheet
The updated spreadsheet showing the Momentum Signal as on the close of 27th April 2010, is given below.

Projected Momentum Signal Close Values
The projected levels of closing values corresponding to the momentum shift / neutrality / continuation as on the close of trading on 28th April, 2010 are given in the table below. The table also include the projected closing values of BSE Sensex corresponding to the momentum shift / neutrality / continuation signals.
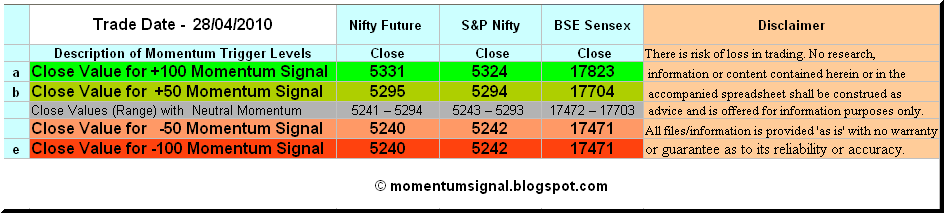
You can click on the table to enlarge. For more info on the above table, please click here.
Please do write in your suggestions and comments about this blog.
Cheers and Prosperous Investing and Trading!!!
You can use the free online Position Limit Calculator from here.
You can also checkout the five year history of The Momentum Signal Spreadsheet from here.
You can also checkout the five year history of The Momentum Signal Spreadsheet from here.
© 2010 momentumsignal.blogspot.com All rights reserved.
Disclaimer: No research, information or content contained herein or in the accompanied spreadsheet shall be construed as advice and is offered for information purposes only. We shall not be responsible and disclaim any liability for any loss, liability, damage (whether direct or consequential) or expense of any nature whatsoever which may be suffered by the user or any third party as a result of or which may be attributable, directly or indirectly, to the use of or reliance on any information or service provided. All files/information is provided 'as is' with no warranty or guarantee as to its reliability or accuracy.


