google.com, pub-7808368332557457, DIRECT, f08c47fec0942fa0 The Ultimate Momentum Signal: 09/01/2010 - 10/01/2010

Wednesday, September 29, 2010

Update on The Ultimate Momentum Signal - 30th Sept. 2010

Another Wave of Profit Booking ... !!! 

Nifty Futures were expected to test the rally highs because of the  late momentum on the previous day and the positive state of Asian markets at the time of the opening.  Nifty futures opened higher too as expected. However, the higher opening actually became a good 'sell in to the rally' opportunity by hindsight.  ( As a consolation, the underlying index, Nifty almost reached the rally high at the time of opening . However, the current month futures contracts just recorded a high of 6075, just 3 points above the index high. ). The mild profit booking turned almost in to a full fledged sell off and futures closed below the previous day's range.  No intra day rallies were able to rise above 20 points from the lows during the day. Wednesday's candle has engulfed the previous day's candle, may be, indicating a trend change. By hindsight, Tuesday's candle now seems to be of the hanging man type which normally occurs before trend changes.  Such candles are formed when the first wave of selling is bought off and the market closes near the open. However, market is unable to buy off the next round of selling and falls . 


Strong and long running rallies like the one we just had are capable of springing a surprise by another leg of short covering rally. A reversal of the uptrend is yet to be confirmed by the market action. This confirmation will be available only when the markets trades and stays below the previous mid-week low of 5940.

 Nifty Futures - Daily Chart    


The existing long positions entered  as per the Ultimate Momentum Signal at the market level of 5576 were exited as on Wednesday's closing at 5597. The trade generated a profit of 420 points. ( The profit quantum of  420 ( char sow beez ) is purely coincidental ;-))  ). As the market has closed in the neutral territory and because of the derivative expiry, the next direction of the market remains unpredictable.

Nifty Valuations : The trailing PE multiple of Nifty index is still quoting above the 25 mark. The historical price earning ( PE Ratio ), price to book value ( PB Ratio ) and dividend yield ( DY Ratio ) of the Nifty Index  were at 25.29, 3.79 and 1.03 as on 29th September 2010. Readers may please note that the periods in which the Nifty index traded above a historical PE Ratio 25 are very limited and both such periods were the blow out stages of earlier bull markets. ( More information and analysis on Nifty historical valuation is available from the "Nifty Fundas" page of this blog. )  The following table shows the latest data related  to Nifty historical valuations as seen from the NSE, India website.   


Updated Momentum Signal Spreadsheet

The updated spreadsheet showing the Momentum Signal as at the close of the trading on  29th September, 2010 is given below :


The Ultimate Momentum Signal has fallen to the nuetral territory with a value of +10 indicating the system exit of the long positions.   
 
Projected Momentum Signal Close Values
 
The projected levels Momentum Signal values applicable to various ranges of closing values of the current month Nifty Futures, Nifty Index and the BSE Sensex,  as at the close of next trading day, ie. as on 30th September, 2010, are given in the following table.
 

   Please click on the table to enlarge. For more info on the above table,  please click here.

Please do post your suggestions and comments on how this blog can be made more useful.
 
Cheers and Prosperous Investing and Trading !!!

To access and/or download  the free online Position Limit Calculator click here.

To checkout the five year history of The Momentum Signal Spreadsheet click here

© 2010, momentumsignal.blogspot.com All rights reserved.

Disclaimer: No research, information or content contained herein or in the accompanied spreadsheet shall be construed as advice and is offered for information purposes only. We shall not be responsible and disclaim any liability for any loss, liability, damage (whether direct or consequential) or expense of any nature whatsoever which may be suffered by the user or any third party as a result of or which may be attributable, directly or indirectly, to the use of or reliance on any information or service provided. All files/information is provided 'as is' with no warranty or guarantee as to its reliability or accuracy.

Update on The Ultimate Momentum Signal - 29th Sept. 2010

Another Test of the Highs ... ?

Nifty futures were expected to open flat and trade in a directionless manner as stated in the previous post.  It opened flat at 6050 and traded sideways in the morning session. However, by the time the European markets opened with losses nearing a percent each, Nifty futures too sold off to reach a low of 6003. Nifty futures recovered from these lows slowly but the recovery turned in to an intra day short covering rally. The rally almost reached the highs of the day at 6064. The futures closed for the day at 6055. Tuesday's lows of the Nifty Futures and the underlying Nifty index coincided with their 5 Day Exponential Moving Averages ( EMA ).   The support seen at the 6000 level and the momentum of the intra day covering rally, which again trapped the sellers, may help Nifty futures to test the rally highs once again on Wednesday.


 Nifty Futures - Daily Chart   


Tuesday's candle has it's long tail on the downside indicating buying or support at the lower parts of the day's trading range. The combined  open interest of the two near month contracts of Nifty saw an addition of 5.97 lakhs ( 0.597 million ) as on Tuesday.  The near month ( Sept ) 6200 put open interest also saw  significant  addition  of 8.31 lakhs ( 0.831 million ) as on Tuesday. These two facts may indicate some upside for the Nifty futures before the expiry on Thursday.

Nifty Valuations : The trailing PE multiple of Nifty index is still quoting above the 25 mark. The historical price earning ( PE Ratio ), price to book value ( PB Ratio ) and dividend yield ( DY Ratio ) of the Nifty Index  were at 25.45, 3.82 and 1.03 as on 28th September 2010. Readers may please note that the periods in which the Nifty index traded above a historical PE Ratio 25 are very limited and both such periods were the blow out stages of earlier bull markets. ( More information and analysis on Nifty historical valuation is available from the "Nifty Fundas" page of this blog. )  The following table shows the latest data related  to Nifty historical valuations as seen from the NSE, India website.   


Updated Momentum Signal Spreadsheet

The updated spreadsheet showing the Momentum Signal as at the close of the trading on  28th September, 2010 is given below :


Nifty futures and the tracked indices have closed with the upward Momentum Signal values of +80 for the fourth day in succession.


Projected Momentum Signal Close Values
 
The projected levels Momentum Signal values applicable to various ranges of closing values of the current month Nifty Futures, Nifty Index and the BSE Sensex,  as at the close of next trading day, ie. as on   29th September, 2010, are given in the following table.


   Please click on the table to enlarge. For more info on the above table,  please click here.

As seen from the above table, any further correction or consolidation may lead to the Momentum Signal trading system indicating an exit of the existing long positions taken at the 5576 levels. 

The trading stop for long positions under the Ultimate Momentum Signal system  stands raised to 5965 ( i.e. 6093 minus 2.1 % of 6093 ). Traders may raise the trading stop to 97.9 % of the new high, as and when the market makes such new highs.
 
Cheers and Prosperous Investing and Trading !!!

To access and/or download  the free online Position Limit Calculator click here.

To checkout the five year history of The Momentum Signal Spreadsheet click here


© 2010, momentumsignal.blogspot.com All rights reserved.

Disclaimer: No research, information or content contained herein or in the accompanied spreadsheet shall be construed as advice and is offered for information purposes only. We shall not be responsible and disclaim any liability for any loss, liability, damage (whether direct or consequential) or expense of any nature whatsoever which may be suffered by the user or any third party as a result of or which may be attributable, directly or indirectly, to the use of or reliance on any information or service provided. All files/information is provided 'as is' with no warranty or guarantee as to its reliability or accuracy.

Tuesday, September 28, 2010

Update on The Ultimate Momentum Signal - 28th Sept. 2010

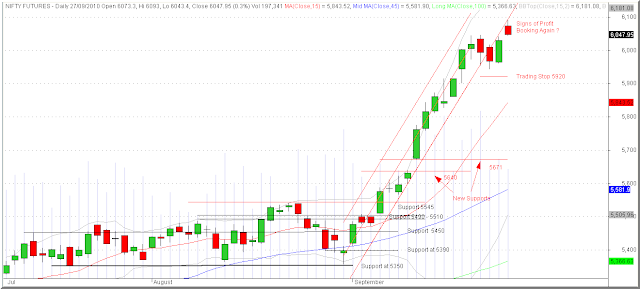
   Signs of Profit Booking Again ... ?

Nifty futures opened positively with a gap at 6070 on Monday on the back of over all positive momentum . It recorded the morning session's low of 6060 at the opening minutes itself. The futures again rallied to test the highs and recorded the day's high of 6093 before noon. However, as the futures were unable to break the 6093 high, it tested the lower end of the day's trading range and to fill the opening gap. Once the 6070 mark was broken, it reached the previous rally high of 6048 with in a very short time. It rallied 15 points  or so and in the the next test of the lows it even reached the Friday's high of 6043.80. It seems that some buying emerged at both these points. However, the closing was at 6048 near the lows. 

Oh, What a coincidence !!  Readers may remember that this blog had given 6090 as the Monday's target for current month  Nifty futures.  And the Monday's high coincided with the target at 6090, being the interception point of the new daily bar and the lower boundary of the narrow regression channel. Friday's high also coincided with the lower boundary of the channel.  Monday's low also coincided with the previous bar's high. ( BTW, Tuesday's interception point with the lower end of the regression channel is at 6135 levels. However, the utility of this projected level remains questionable for Tuesday's trading. )

Signs of Profit Booking ?   Monday's trading has lead to some liquidation of Nifty futures positions. The combined reduction in the open interest of the two near month Nifty futures contracts amounted to 23 lakhs  ( 2.3 million ) as on Monday. Many individual daily stock charts were showing red candles on Monday. The advance decline ratio also remained slightly on the negative side. All these facts are pointing towards some profit booking on Monday.

Nifty Futures - Daily Chart   


The BSE Sensex chart shows a shooting star candle as on Monday. Both the charts of Nifty and it's futures are showing tails  at the top indicating selling / profit booking. We may expect neutral or directionless trading on Tuesday. The highest levels of open interest positions in the current month Nifty options are at 6000 and 6100 strikes at present. These two levels may act as the support and resistance in the immediate future.

Nifty Valuations : The trailing PE multiple of Nifty index is quoting above the 25 mark. The historical price earning ( PE Ratio ), price to book value ( PB Ratio ) and dividend yield ( DY Ratio ) of the Nifty Index  were at 25.48, 3.89 and 1.01 as on 27th September 2010. Readers may please note that the periods in which the Nifty index traded above a historical PE Ratio 25 are very limited and both such periods were the blow out stages of earlier bull markets. ( More information and analysis on Nifty historical valuation is available from the "Nifty Fundas" page of this blog. )  The following table shows the latest data related  to Nifty historical valuations as seen from the NSE, India website.   

Nifty Index - PE, PB and DY Ratios

Updated Momentum Signal Spreadsheet

The updated spreadsheet showing the Momentum Signal as at the close of the trading on  27th September, 2010 is given below : 


Nifty futures and the tracked indices have closed with the upward Momentum Signal values of +80 for the third day in succession.


Projected Momentum Signal Close Values
 
The projected levels Momentum Signal values applicable to various ranges of closing values of the current month Nifty Futures, Nifty Index and the BSE Sensex,  as at the close of next trading day, ie. as on   28th September, 2010, are given in the following table.


   Please click on the table to enlarge. For more info on the above table,  please click here.

As seen from the above table, any further correction or consolidation may lead to the Momentum Signal trading system indicating an exit of the existing long positions taken at the 5576 levels. 


The trading stop for long positions under the Ultimate Momentum Signal system  stands raised to 5965 ( i.e. 6093 minus 2.1 % of 6093 ). Traders may raise the trading stop to 97.9 % of the new high, as and when the market makes such new highs.
 
Cheers and Prosperous Investing and Trading !!!

To access and/or download  the free online Position Limit Calculator click here.

To checkout the five year history of The Momentum Signal Spreadsheet click here


© 2010, momentumsignal.blogspot.com  All rights reserved.

Disclaimer: No research, information or content contained herein or in the accompanied spreadsheet shall be construed as advice and is offered for information purposes only. We shall not be responsible and disclaim any liability for any loss, liability, damage (whether direct or consequential) or expense of any nature whatsoever which may be suffered by the user or any third party as a result of or which may be attributable, directly or indirectly, to the use of or reliance on any information or service provided. All files/information is provided 'as is' with no warranty or guarantee as to its reliability or accuracy.

Sunday, September 26, 2010

Update on The Ultimate Momentum Signal - 27th Sept. 2010

    Another New Week and Another New High ... ?

As expected, Nifty future opened flat last Friday. Since the Thursday's profit booking/selling wasn't enough to break the 5950 - 5960 support convincingly, it tried to test the highs.  ( Please read the previous post explaining that a mere ten point break of any reference point in the Nifty futures is not a confirmed break signaling a change of direction ).  After hovering in a 20 point range between  the 5960 - 5980 range, it gained further and spent it's time below the 6000 mark till noon. By the time the European markets were opening, futures regained further strength and went on to record a high of 6043, just below the rally high of 6048, in the last half an hour of trading.  Nifty futures closed for the week at 6030.  The over all positive momentum remains intact even though the market has  been going through a pause or consolidation phase for the last three trading days.  As the US market  has closed on a very strong note on last Friday, the positive momentum in the Indian as well as the  international markets may help the Nifty futures to record a new rally high in the early part of the new trading week.

Nifty Futures - Daily Chart    


The chart above shows the consolidation by the Nifty futures for the last three trading days. It has traded outside the narrow regression channel too. Now the lower boundary of the regression channel may become a minor resistance for the Nifty futures. The projected interception point of the Monday's candle and the lower boundary of the regression channel  is at 6090 levels. Therefore,  the level of 6090 may be taken as a target for Monday in case the Nifty future breaks out above the previous week's high of 6048. 

Nifty Index - Weekly Chart


The above weekly chart of the Nifty index shows the eleven month old trading channel and the breakout above the channel. The medium term target for the breakout remains at the range 6250 to the previous all time highs at 6330. However, this target  is given only as  a probability and not as a trade recommendation. Any new  long trading positions in  an already maturing rally are suitable only to the experienced and  nimble traders. This is also because of the rich valuation levels being obtained in Indian markets at present, which is explained in the next paragraph.

The trailing PE multiple of Nifty index is quoting above the 25 mark. The historical price earning ( PE Ratio ), price to book value ( PB Ratio ) and dividend yield ( DY Ratio ) of the Nifty Index  were at 25.41, 3.88 and 1.02 as on 24th September 2010. Readers may please note that the periods in which the Nifty index traded above a historical PE Ratio 25 are very limited and both such periods were the blow out stages of earlier bull markets. ( More information and analysis on Nifty historical valuation is available from the "Nifty Fundas" page of this blog. )  The following table shows the latest data related  to Nifty historical valuations as seen from the NSE, India website.   

Nifty Index - PE, PB and DY Ratios


Updated Momentum Signal Spreadsheet

The updated spreadsheet showing the Momentum Signal as at the close of the trading on  24th September, 2010 is given below : 


Nifty futures and the tracked indices have closed with the upward Momentum Signal values of +80 as on last Friday.

Projected Momentum Signal Close Values

The projected levels Momentum Signal values applicable to various ranges of closing values of the current month Nifty Futures, Nifty Index and the BSE Sensex,  as at the close of next trading day, ie. as on   27th September, 2010, are given in the following table.

   Please click on the table to enlarge. For more info on the above table,  please click here.

As seen from the above table, any further correction or consolidation may lead to the Momentum Signal trading system indicating an exit of the existing long positions taken at the 5576 levels. 


The trading stop for long positions under the Ultimate Momentum Signal system  remains at 5920 ( i.e. 6048 minus 2.1 % of 6048 ). Traders may raise the trading stop to 97.9 % of the new high, as and when the market makes such new highs.
 
© 2010, momentumsignal.blogspot.com All rights reserved.

Disclaimer: No research, information or content contained herein or in the accompanied spreadsheet shall be construed as advice and is offered for information purposes only. We shall not be responsible and disclaim any liability for any loss, liability, damage (whether direct or consequential) or expense of any nature whatsoever which may be suffered by the user or any third party as a result of or which may be attributable, directly or indirectly, to the use of or reliance on any information or service provided. All files/information is provided 'as is' with no warranty or guarantee as to its reliability or accuracy.

Thursday, September 23, 2010

Update on The Ultimate Momentum Signal - 24th Sept. 2010

    Profit Booking Continues ... !!!

This blog had been stating that  signs of profit booking is being shown by the market  for the past two trading day's and it may continue.  For the second day in the running, Nifty futures opened higher and recorded the day's highs in the first minute of trading.  However, on Thursday, the futures went to  the negative territory immediately after the opening. It just hovered between 5960 and 5980 for most of the morning session. An attempt to recover  in the middle of the day could raise it to the previous day's last traded price. Therefore, more sellers emerged and the resultant slide was arrested at just 10 points below the previous day's low.  ( This blog has been repeatedly making a statement that a ten point break of any reference point in the Nifty futures do not confirm a real break ). The futures recovered from the lows and closed inside the morning session's range at 5967.  The next direction of the market remains unpredictable. Therefore, it may spend some more time in a flat to negative consolidation. 

Thursday's market action still reveals signs of profit booking. The open interest in the two front month Nifty futures contracts fell by 7.67 lakhs ( 0.767 million ) as on Thursday. However, the rate of liquidation seems to have slowed down in comparison to the  two previous trading days. The trading volume was also subdued.         

Nifty Futures - Daily Chart

Nifty future has closed outside the narrow regression channel for the first time in sixteen trading days confirming either a pause, consolidation or correction.
 
The historical PE multiple of Nifty index is still above the 25 mark. The historical price earning ( PE Ratio ), price to book value ( PB Ratio ) and dividend yield ( DY Ratio ) of the Nifty Index rare at 25.16, 3.84 and 1.03 as on 23rd September 2010. Readers may please note that the periods in which the Nifty index traded above a historical PE Ratio 25 are very limited and both such periods were the blow out stages of earlier bull markets. ( More information and analysis on Nifty historical valuation is available from the "Nifty Fundas" page of this blog. ) The following table shows the latest data related  to Nifty historical valuations as seen from the NSE, India website. 
Nifty Index - PE, PB and DY Ratios


Updated Momentum Signal Spreadsheet

The updated spreadsheet showing the Momentum Signal as at the close of the trading on  23rd  September, 2010 is given below : 

Nifty futures and Nifty index have both closed with the upward Momentum Signal values of + 80.  However, BSE Sensex closed with a Momentum Signal value of  +100  for the thirteenth consecutive trading day.


Projected Momentum Signal Close Values

The projected levels Momentum Signal values applicable to various ranges of closing values of the Nifty Futures, Nifty Index and the BSE Sensex,  as at the close of next trading day, ie. as on   24th September, 2010, are given in the following table.

   Please click on the table to enlarge. For more info on the above table,  please click here.


The trading stop for long positions under the Ultimate Momentum Signal system  remains at   5920 ( i.e. 6048 minus 2.1 % of 6048 ). Traders may raise the trading stop to 97.9 % of the new high, if and when the market makes such new highs. Any further correction may lead to the exit of the long position.
 

© 2010, momentumsignal.blogspot.com All rights reserved.

Disclaimer: No research, information or content contained herein or in the accompanied spreadsheet shall be construed as advice and is offered for information purposes only. We shall not be responsible and disclaim any liability for any loss, liability, damage (whether direct or consequential) or expense of any nature whatsoever which may be suffered by the user or any third party as a result of or which may be attributable, directly or indirectly, to the use of or reliance on any information or service provided. All files/information is provided 'as is' with no warranty or guarantee as to its reliability or accuracy.

Wednesday, September 22, 2010

Update on The Ultimate Momentum Signal - 23rd Sept. 2010

   Profit Booking to Continue ... ?

Yesterday's post was titled "   Signs of profit Booking ... ? " because of the negative advance decline ratio and the liquidation seen in the current month Nifty futures on Tuesday. And as expected, the profit booking ensued in Wednesday's trading. Nifty futures opened in the green on Wednesday as is common in strong bull markets. It recorded the day's high of 6048 in the very opening of trade too. However, after hovering in the top end of the previous day's trading range for less than an hour, the profit booking started. The market sold of almost 100 points and the futures recorded a low of 5953. This low also coincided with the support of the narrow regression channel as shown in the previous day's post as well as the previous rally target of 5950 to 5960 area according to the the gap theory. Nifty futures recovered from this minor support area and even staged a rally of 50- 60 points. The futures finally closed at 5993.

Wednesday's trading showed very high volume as well as further liquidation of positions in the Nifty futures. The net reduction in the open interest after accounting for the shifting of positions to the October series in the two front months amounted to 14.26 lakhs ( 1.426 million ). This figure is even higher than the previous day's net reduction in the open interest figures. The advance decline ratio also recorded a much more negative figure on Wednesday. These facts may indicate the continuation of the profit booking leg for some more time. Moreover, the minor support from the narrow regression channel has gone up steeply to the 6000 level for Thursday's trading.  As already stated in the previous post, any close outside the narrow regression channel may confirm the consolidation or pause stage of the rally.

Nifty Futures - Daily Chart


The trading stop for the long positions under the Ultimate Momentum Signal trading system remains at 5920 which is 2.1 % below the rally high of 6048.


The historical price earning ( PE Ratio ), price to book value ( PB Ratio ) and dividend yield ( DY Ratio ) of the Nifty Index reached 25.29, 3.86 and 1.02 as on 22nd September 2010. The following table  shows  the latest  Nifty historical fundamental valuations data from the NSE, India website. Readers may please note that the periods in which the Nifty index traded above a historical PE Ratio 25 are very limited and both such periods were the blow out stages of earlier bull markets. ( More information and analysis on Nifty historical valuation is available from the "Nifty Fundas" page of this blog. ) 

Nifty Index - PE, PB and DY Ratios


Updated Momentum Signal Spreadsheet

The updated spreadsheet showing the Momentum Signal as at the close of the trading on  22nd  September, 2010 is given below : 
Nifty futures and the tracked indices have closed with the maximum upward Momentum Signal values of +100 for the twelfth consecutive trading day.

Projected Momentum Signal Close Values

The projected levels Momentum Signal values applicable to various ranges of closing values of the Nifty Futures, Nifty Index and the BSE Sensex,  as at the close of next trading day, ie. as on   23rd September, 2010, are given in the following table.

   Please click on the table to enlarge. For more info on the above table,  please click here.


The trading stop for long positions under the Ultimate Momentum Signal system  stands raised to    5920 ( i.e. 6048 minus 2.1 % of 6048 ). Traders may raise the trading stop to 97.9 % of the new high, as and when the market makes such new highs.
 
© 2010, momentumsignal.blogspot.com All rights reserved.

Disclaimer: No research, information or content contained herein or in the accompanied spreadsheet shall be construed as advice and is offered for information purposes only. We shall not be responsible and disclaim any liability for any loss, liability, damage (whether direct or consequential) or expense of any nature whatsoever which may be suffered by the user or any third party as a result of or which may be attributable, directly or indirectly, to the use of or reliance on any information or service provided. All files/information is provided 'as is' with no warranty or guarantee as to its reliability or accuracy.

Update on The Ultimate Momentum Signal - 22nd Sept. 2010

   Signs of profit Booking ... ?

Nifty futures opened with positive momentum on Tuesday and the day's high of 6046 was recorded in the early part of session. The widely followed indices Nifty and BSE Sensex hitting important round figure milestones of 6000 and 20000 seems to have attracted a bout of profit booking on Tuesday. The market recorded the day's low of 5972 in the first one and a half hours. The markets hovered just above the positive territory in a two trade mode for the whole trading day thereafter. Nifty futures and both the major indices closed above the important psychological levels of the earlier mentioned round figure marks. However, the advance decline ratio as seen on TV showed a negative picture of  declines of 5 shares against every advancing share.  Tuesday's trading also witnessed a marked decline in the open interest of the Nifty September contracts to the extent 23.50 lakhs ( 2.35 million ).  These two facts points to a bout of profit booking which may continue before the next leg of the rally.   

Nifty Futures - Daily Chart


The above chart shows the regression channel in which the strong rally has taken place. ( Well, the rally happened initially and the channel came later ! ).  Any minor sideways move or pause in the market may be supported by the narrow regression channel. Later on, a break of the narrow regression channel may indicate the deceleration of the rally too.


Readers of this blog might remember that this blog had been discussing the possibility of an irrational ( ? ) mad rush to get in to stocks in case of the market making a breakout above the eleven month old upward moving trading channel. ( Please read the posts dated 23rd August and 9the September, 2010 ).  Now let's revisit the Nifty index chart showing the old trading channel. 

Nifty Index Daily Chart 


The chart above clearly explains why the breakout was considered significant and why the markets behaved in the form of a run away rally after the breakout. Now, the the original channel had a height of approximately 650 points. Therefore, the breakout can also travel an equivalent height of 650 points from the breakout point of 5600. This effectively gives a target of 5250 which is just 75 points below the all time highs. A word of caution too. This target is discussed just for the purpose of learning technical analysis  concepts and not as trade recommendation. Market may or may not reach the target. Even if it reaches the target, it may happen even after a correction in which all fresh bulls may be shaken out.


World Markets   

 
The widely followed US S&P 500 index seems to have broken out above the crucial level of 1130 after a long stint below this level. The NBER, ( US National Beuro of Economic Research ) has also confirmed the end of the recession in the US. This fact together with the still continuing extreme cheap money poicies may help the continuation of the equity rally world over.

US S&P 500 Index - Daily Chart


Meanwhile the historical price earning ( PE Ratio ), price to book value ( PB Ratio ) and dividend yield ( DY Ratio ) of the Nifty Index reached 25.37, 3.87 and 1.02 as on 21st Septeber 2010. The following is a snapshot of the Nifty historical fundamental as seen from the NSE, India website.

Nifty Index - PE, PB and DY Ratios


Updated Momentum Signal Spreadsheet

The updated spreadsheet showing the Momentum Signal as at the close of the trading on  21st  September, 2010 is given below : 
Nifty futures and the tracked indices have closed with the maximum upward Momentum Signal values of +100 for the eleventh  consecutive trading day.
 

Projected Momentum Signal Close Values

The projected levels Momentum Signal values applicable to various ranges of closing values of the Nifty Futures, Nifty Index and the BSE Sensex,  as at the close of next trading day, ie. as on   22nd September, 2010, are given in the following table.
   Please click on the table to enlarge. For more info on the above table,  please click here.

The trading stop for long positions under the Ultimate Momentum Signal system  stands raised to    5919 ( i.e. 6046 minus 2.1 % of 6046 ). Traders may raise the trading stop to 97.9 % of the new high, as and when the market makes such new highs.
 

© 2010, momentumsignal.blogspot.com All rights reserved.

Disclaimer: No research, information or content contained herein or in the accompanied spreadsheet shall be construed as advice and is offered for information purposes only. We shall not be responsible and disclaim any liability for any loss, liability, damage (whether direct or consequential) or expense of any nature whatsoever which may be suffered by the user or any third party as a result of or which may be attributable, directly or indirectly, to the use of or reliance on any information or service provided. All files/information is provided 'as is' with no warranty or guarantee as to its reliability or accuracy.

Tuesday, September 21, 2010

Update on The Ultimate Momentum Signal - 21st Sept. 2010

  Another Super Duper Monday ... !!!

The Nifty futures closed at the day's highs on last Friday indicating the buying pressure. And some follow up buying was also expected on Monday. As expected, the Futures opened higher and almost immediately set out for a test of the 5960 target already pointed out on this blog in the posts dated 16th and 20th September. Normally, some profit booking can be expected at such widely known targets. The Nifty futures corrected only 20 points from the said target of 5960 and again tried to test the highs. In this process of  the second test of the 5960 area, the correction from the target was limited only to just the half the points of the first.  As already explained on this blog that the third test of any support or resistance has more of a chance to effect a breakout, the third test of the target of the 5960 area resulted in an intraday breakout. And once again the bears were trapped.  It is better to remain  long instead of trying to find targets as strong bull markets have no resistances. The next minor resistances are at 6050 and 6200 before the resistance offered by the all time high at 6330.    

 Nifty Futures - Daily Chart     

 
The ferocious nature of the almost vertical rally indicates that the Nifty future is poised to test the all time highs once again. However, as the markets may not directly reach the said target and some shake out of the new bulls may happen, traders may not act on this opinion under any circumstances by making fresh long positions in the market just on the basis of this opinion. Let's see what the market does on a day to day basis and come to the conclusions on the basis of the latest happenings. 

Meanwhile the historical price earning ( PE Ratio ), price to book value ( PB Ratio ) and dividend yield ( DY Ratio ) of the Nifty Index reached 25.25, 3.93 and 1.01 as on 20th Septeber 2010. The following is a snapshot of the Nifty historical fundamental as seen from the NSE, India website.

Nifty Index - PE, PB and DY Ratios


Updated Momentum Signal Spreadsheet

The updated spreadsheet showing the Momentum Signal as at the close of the trading on  20th  September, 2010 is given below :


Nifty futures and the tracked indices have closed with the maximum upward Momentum Signal values of +100 for the tenth  consecutive trading day.

Projected Momentum Signal Close Values

The projected levels Momentum Signal values applicable to various ranges of closing values of the Nifty Futures, Nifty Index and the BSE Sensex,  as at the close of next trading day, ie. as on   21st September, 2010, are given in the following table.
  Please click on the table to enlarge. For more info on the above table,  please click here.
The above table also indicates the extra ordinary strength of the bull rally because, even after a passage of ten days after the buy signal, the exit signal are still placed far lower than the current market levels. 
However, The trading stop for long positions under the Ultimate Momentum Signal system  stands raised to    5879 ( i.e. 6006 minus 2.1 % of 6006 ). Traders may raise the trading stop to 97.9 % of the new high, as and when the market makes such new highs.
© 2010, momentumsignal.blogspot.com All rights reserved.

Disclaimer: No research, information or content contained herein or in the accompanied spreadsheet shall be construed as advice and is offered for information purposes only. We shall not be responsible and disclaim any liability for any loss, liability, damage (whether direct or consequential) or expense of any nature whatsoever which may be suffered by the user or any third party as a result of or which may be attributable, directly or indirectly, to the use of or reliance on any information or service provided. All files/information is provided 'as is' with no warranty or guarantee as to its reliability or accuracy.
Sunday, September 19, 2010

Update on The Ultimate Momentum Signal - 20th Sept. 2010

   A New Week and a New High Too ... ?  


Nifty futures made a phenomenal rally last week on the back of the relentless buying by  FIIs. The market close was near the highs too. Now the question is whether the market will be able to sustain the last week's run rate in this week too. Even though the Ultimate Momentum Signal system do not involve any forecasting or prediction of targets and it just keeps the positions as such until exited by the application of system rules, let's revisit the post dated 16th September in which  the immediate  target  was arrived at. According to the good old simple gap theory of the technical analysis, the target remains at the 4950 to 4960 area.  And the market may reach the said target in the early part of the new week. However, traders may consider two factors after a week of relentless rally. The first is that the rally may decelerate as no markets can continue in a single direction without any breathers. And the second is that the markets have no big resistances above and the only major resistance is at the previous all time high. Therefore, the rally may become a bit more broad based while the front runners ( the major Nifty companies ) take a breather. The symptoms of the rally becoming much more broad based ( rally spreading to the midcaps ) was seen on last Friday as seen in the improvement in the advance declines ratio.

 Nifty Futures - Daily Chart    


The immediate target of 4950 to 4960 area is shown in the daily chart of the Nifty futures above. However, a comparison of the present valuation of the Indian market  to the historical valuation levels obtained in the two previous boom bust sequences, indicates that the markets have become quite expensive right now. ( For more information on historical fundamantal analysis of the Nifty index please read ' Nifty Fundas ' page from here.) The ultra cheap money policies of the recession hit countries  and the resultant excess liquidity is the only real reason behind the FIIs buying. Another saving grace which favors the rally can be the still ongoing monsoons. The Indian institutions are rather on a profit booking mode than participating in the rally by any  aggressive buying. The present day valuations can be justified only by a corporate profit growth at least 25 % for the FY 2011. As the first quarter results were rather lukewarm, corporate India has to do some unprecedented kind of profit growth in the remaining months of the year to reach such ideal growth rates.  Therefore,  any reversal in the foreign fund flows may result in a bout of panic selling  and a correction.  The price earning ( PE Ratio ), price to book value ( PB Ratio ) and dividend yield ( DY Ratio ) of the Nifty Index as seen from the NSE, India website is shown below. 


Updated Momentum Signal Spreadsheet

The updated spreadsheet showing the Momentum Signal as at the close of the trading on  17th  September, 2010 is given below : 
 
 
Nifty futures and the tracked indices have closed with the maximum upward Momentum Signal values of +100 for the ninth consecutive day.
 
Projected Momentum Signal Close Values

The projected levels Momentum Signal values applicable to various ranges of closing values of the Nifty Futures, Nifty Index and the BSE Sensex,  as at the close of next trading day, ie. as on   20th September, 2010, are given in the following table.


 Please click on the table to enlarge. For more info on the above table,  please click here.  
 
The trading stop for long positions under the Ultimate Momentum Signal system  remains  at  5791 ( i.e. 5916 minus 2.1 % of 5916 ). Traders may raise the trading stop to 97.9 % of the new high, as and when the market makes such new highs.


© 2010, momentumsignal.blogspot.com All rights reserved.

Disclaimer: No research, information or content contained herein or in the accompanied spreadsheet shall be construed as advice and is offered for information purposes only. We shall not be responsible and disclaim any liability for any loss, liability, damage (whether direct or consequential) or expense of any nature whatsoever which may be suffered by the user or any third party as a result of or which may be attributable, directly or indirectly, to the use of or reliance on any information or service provided. All files/information is provided 'as is' with no warranty or guarantee as to its reliability or accuracy.