google.com, pub-7808368332557457, DIRECT, f08c47fec0942fa0 The Ultimate Momentum Signal: 07/01/2010 - 08/01/2010

Friday, July 30, 2010

Update on The Ultimate Momentum Signal - 30th July, 2010

Another Day of Range Bound Trading ... !!!

The Nifty futures opened flat on the expiry day of the of the July month contracts. As the market didn't break the Wednesday's lows convincingly, the market tried to test the highs of the previous trading range between 5360 and 5410. It was also supported by the opening  of the European markets in the positive territory. The futures recorded a high of 5415 in the after noon session and closed at 5408.75. As this blog has repeatedly been disclosing,  it seems that the sell indicated by the Momentum Signal may not have much effect since the market is still trading in the narrow trading range. ( Quote from the last post : " However, as already stated in the previous posts, this sell signal will be confirmed by the market action only if the market breaks the 5350 levels. "

Nifty Futures - Daily Chart


Since the Nifty future has broken the black support line, it may become the resistance line immediately. However, Nifty future is still trading above its support at 5350-5360 levels. The daily trading ranges have also become very narrow these days. The lower panel of the above chart  shows the various ATR values of the front month Nifty futures in percentage value.  It can be seen from the chart that the Thursday's trading range is one of the narrowest ones seen recently. The 5 ATR has also been recording new recent lows.So long as the rally continues, the market may record narrow daily trading ranges with occasional spurts. 

World Markets

The following the daily chart of the US Dow Jones Index. The index seems to be retracing from a double top at present. ( See the upper panel of the chart. )

US Dow Jones Index  - Daily Chart


The lower panel of the chart shows the various daily moving averages. It is seen that the Dow Jones index is facing trading just above it's 200 DMA and is facing resistance from it's 100 DMA. The last time it reached these levels it corrected 4 %. In case the DJIA is able to trade above the  10,600 levels it may augment the present rally in the Indian markets to new highs. If this scenario takes place, the Nifty Index may test it's overhead resistance at the 5500 to 5550 area.      

Even though the European stock indices spent most of the trading day in the positive territory, the markets there finished with moderate losses in the end. The FTSE, CAC and DAX closed with losses of 0.11, 0.50 and 0.72 percents respectively. The US stock indices too opened in the positive territory and soon recorded losses on the back of the comments on the US economy made by James Bullard, the president of the Federal Reserve Bank of St. Louis. He warned that the American economy may get “enmeshed in a Japanese-style deflationary outcome within the next several years.”  The US stock indices were trading with moderate losses of 0.2 to 0.50 % at 00.00 HRS IST.

Updated Momentum Signal Spreadsheet

The updated spreadsheet showing the Momentum Signal as on the close of  29th July 2010, is given below.


The above spread sheet is prepared using the current month future's last traded price. However, it seems that if the values of August futures were used, the system would have shown a neutral value. The Sensex, however closed in the sell area on Thursday.

Projected Momentum Signal Close Values

The projected levels Momentum Signal values applicable to various ranges of closing values of the Nifty Futures, Nifty Index and the BSE Sensex,  as at the close of next trading day, ie. as on  30th July, 2010, are given in the following table. 

  Please click on the table to enlarge. For more info on the above table,  please click here.  
 
As the Momentum Signal is primarily a trend following system, it may indicate whipsaw signals in range bound markets. As such, all readers of this blog are requested to read the various pages describing the system and understand all the intricacies of trading the Momentum Signal and it's risk factors too. Please do write in your comments and suggestions.


© 2010, momentumsignal.blogspot.com All rights reserved. 

Disclaimer: No research, information or content contained herein or in the accompanied spreadsheet shall be construed as advice and is offered for information purposes only. We shall not be responsible and disclaim any liability for any loss, liability, damage (whether direct or consequential) or expense of any nature whatsoever which may be suffered by the user or any third party as a result of or which may be attributable, directly or indirectly, to the use of or reliance on any information or service provided. All files/information is provided 'as is' with no warranty or guarantee as to its reliability or accuracy.

Wednesday, July 28, 2010

Update on The Ultimate Momentum Signal - 29th July, 2010

 Range Bound Markets and Another Sell Signal ... ?

The markets have been trading top heavy for some time now. This blog has also been writing about the rich valuations of the the markets for some time. These days, the trading  has been concentrated on limited number of large caps and mainly on small caps and mid caps. The market has been encountering selling pressure at the higher levels for some time. And these are  the classical symbols of an intermediate top too.

The Nifty futures opened in the positive territory on Wednesday and traded flat for half the trading day. However by midday, the weakness in the market heavy weight, Reliance, started to affect the market as a whole and the market returned to the middle of the earlier narrow trading band between 5350 and 5410. The Nifty futures closed at 5393 for the day. The Momentum Signal system, which indicated an exit of long positions as on Tuesday, has indicated a sell as on Wednesday. However, as already stated in the previous posts, this sell signal will be confirmed by the market action only if the market breaks the 5350 levels. 

Nifty Futures - Daily Chart     


Even though the Nifty future has broken the black support line, it has some support at the 5350 levels as shown by the horizontal red line in the picture. The futures may have lower supports at 5300 and 5225 levels.  

World Markets 

After recording good gains for the past week, the European stock indices, FTSE and DAX corrected by 0.86 and 0.46 percents respectively on Wednesday. However, the French CAC index ended  marginally up with a gain of 0.11 %. The US stock indices were trading with moderate losses on the back of falling durable goods orders and mixed earning reports at 11.30 PM IST.
Updated Momentum Signal Spreadsheet

The updated spreadsheet showing the Momentum Signal as on the close of  28th July 2010, is given below.


The Momentum Signal has indicated a sell on the basis of the last traded prices of the Nifty futures and the Nifty index as at the close of trading on Wedenesday.


Projected Momentum Signal Close Values

The projected levels Momentum Signal values applicable to various ranges of closing values of the Nifty Futures, Nifty Index and the BSE Sensex,  as at the close of next trading day, ie. as on  29th July, 2010, are given in the following table.  
 
      Please click on the table to enlarge. For more info on the above table,  please click here.  

The present sell  signal will be technically confirmed  only when the market  falls below the 5350 levels and trades there for some time with good volumes.  

As the Momentum Signal is primarily a trend following system, it may indicate whipsaw signals in range bound markets. As such, all readers of this blog are requested to read the various pages describing the system and understand all the intricacies of trading the Momentum Signal and it's risk factors too. Please do write in your comments and suggestions.


© 2010, momentumsignal.blogspot.com All rights reserved.

Disclaimer: No research, information or content contained herein or in the accompanied spreadsheet shall be construed as advice and is offered for information purposes only. We shall not be responsible and disclaim any liability for any loss, liability, damage (whether direct or consequential) or expense of any nature whatsoever which may be suffered by the user or any third party as a result of or which may be attributable, directly or indirectly, to the use of or reliance on any information or service provided. All files/information is provided 'as is' with no warranty or guarantee as to its reliability or accuracy.

Tuesday, July 27, 2010

Update on The Ultimate Momentum Signal - 28th July, 2010

 Another Day of Range Bound  Trading ... !!!

As expected, the Nifty futures opened in the positive territory on Tuesday and started the waiting game for the policy action by the RBI. The market spent most of the waiting period by trading around the last day's closing area. Then came the mild hikes in the interest rates which were  already discounted   by the market.  Barring a mild excursion in to negative territory, the market rallied almost to the previous day's high, once the uncertainty of the RBI action was done away with. However, the markets could not sustain the rally and therefore, it returned to the middle of the new trading range and closed at 5433. 

Nifty Future - Daily Chart 


The daily chart of the Nifty futures has recorded yet another doji candle which may indicate a reversal or range bound trading.  For a change, the BSE Sensex returned a solid white candle  of comparatively small trading range for the day. Tuesday's trading has not changed the technical position of the markets. The Futures and the major indices are still trading above their short term support levels. However, the Momentum Signal indicates that all of them have closed in the neutral territory as on Tuesday.

World Markets
Following the momentum of the strong gains in the past week, the European stock market indices closed in the positive territory on Tuesday. The FTSE, CAC and DAX gained 0.27, 0.83 and 0.21 percents respectively even though closing  prices  were off their intra-day highs. After three days  of more than 100 point gains, the  US DJIA too opened in the positive territory alongwith the other Wall Street indices. However, at 11.00 PM IST, the US stock indices were trading flat to the negative territory. Meanwhile, the US Conference  Board Consumer Confidence index for the month of July  has fallen to the lowest  since last February, amid worries about the lack of jobs.

Updated Momentum Signal Spreadsheet

The updated spreadsheet showing the Momentum Signal as on the close of  27th July 2010, is given below.

 The Momentum Signal returned a +30 value indicating neutral conditions for the day.


Projected Momentum Signal Close Values

The projected levels of closing values corresponding to the momentum shift / neutrality / continuation as on the close of trading on 28th July, 2010 are given in the table below. The table also include the projected closing values of BSE Sensex corresponding to the momentum shift / neutrality / continuation signals.

     Please click on the table to enlarge. For more info on the above table,  please click here.  

The trailing stop for all long positions remains at 5360 which is 2.1 % away from the new high. A close below 5381 on Wednesday will lead to the Momentum Signal indicating a sell with -100 value. However, this signal will be technically confirmed  only when the market  falls below the 5350 levels and trades there for some time with good volumes.

As the Momentum Signal is primarily a trend following system, it may indicate whipsaw signals in range bound markets. As such, all readers of this blog are requested to read the various pages describing the system and understand all the intricacies of trading the Momentum Signal and it's risk factors too. Please do write in your comments and suggestions.


© 2010, momentumsignal.blogspot.com All rights reserved.

Disclaimer: No research, information or content contained herein or in the accompanied spreadsheet shall be construed as advice and is offered for information purposes only. We shall not be responsible and disclaim any liability for any loss, liability, damage (whether direct or consequential) or expense of any nature whatsoever which may be suffered by the user or any third party as a result of or which may be attributable, directly or indirectly, to the use of or reliance on any information or service provided. All files/information is provided 'as is' with no warranty or guarantee as to its reliability or accuracy.

Some Thoughts on Interest Rates

  RBI Willing to Strike, But Afraid to Hurt Again ... !!!

The RBI has once again announced  mild hikes of interest rates at the face of accelerating inflation. The repo and reverse repo rates  were hiked by 0.25 and 0.50 % respectively by the RBI today. The last hike did not lead to any hikes in the rates by the Banks on the ground. Going by the reaction of the markets, Tuesday's action too may become inadequate to tame the inflationary expectations. The RBI still expects the inflation to fall to 6 % levels by the next March. However, it may be remembered that inflation was expected to fall to 5.5% by the last March too. ( It seems that the base effect has not been bailing out the 'expert' predictors ! ) So much for the too accommodating policies of the present managers of economy.

Bye the way, no one needs to be an accomplished economist to understand the situation. Just check up the interest rates of one year bank deposits and compare it with the Government's own inflation figures. You can see that the interest rate is much below the inflation rate and therefore, the depositor actually loses his  purchasing power, by making the deposit. This is called negative interest rate and it kills the savings of the depositors and  robs the poor.   

Now, one may ask who are the beneficiaries of these negative interest rates. Of course the big borrowers including the government are the ultimate beneficiaries of the negative interest rates. Even though a bit of mild inflation is supposed to be good for growth in the economy, run away inflation may lead to bubbles and the subsequent busts as happened in the Nineties. The world has not yet been able to recover from the well known busting of the Greenspan bubbles. Do we need another one of the desi variety ?
 
© 2010, momentumsignal.blogspot.com All rights reserved.

Disclaimer: No research, information or content contained herein or in the accompanied spreadsheet shall be construed as advice and is offered for information purposes only. We shall not be responsible and disclaim any liability for any loss, liability, damage (whether direct or consequential) or expense of any nature whatsoever which may be suffered by the user or any third party as a result of or which may be attributable, directly or indirectly, to the use of or reliance on any information or service provided. All files/information is provided 'as is' with no warranty or guarantee as to its reliability or accuracy.

Update on The Ultimate Momentum Signal - 27th July, 2010

 Another Higher Open and A Lower  Close ... !!! 

The Nifty futures opened near the day's highs on Monday and as usual  it  started it's slow downward movement right from the morning. The futures recorded a high of 5464 and a low of 5417 before closing at 5419. Here is a quote from the last post : A higher open and the slow downward trading "is becoming a common pattern of trading these days." However, a lower opening may lead to the opposite too. Following the overnight gains on Wall street, the market may trade in the positive territory on Tuesday morning and then wait for the policy action by the RBI.
Nifty Futures - Daily Chart


The Nifty futures have minor support at the top end of the previous narrow trading range between 5360 and 5410. However, a break of the lower end of the said narrow range may attract serious selling too.  

BSE Sensex - Daily Chart


As seen in the above chart of the BSE Sensex, the last two day's trading has lead to the formation of  doji star candles indicating selling at the higher levels. According to the Momentum Signal system, the  Sensex has closed in the neutral area as on Monday. However, the Sensex and the Nifty  are still trading above their short term support levels.

Tuesday will also see the interest rate hikes by the RBI. A 0.25 to 0.50 %  hike in the repo rate, especially the former, seems to have been discounted by the  market. A 0.25 % hike may be expected in the reverse repo too. However, it seems that the market has not yet discounted any hikes in the cash reserve ratio. The RBI has been following a soft money policy so far, in spite of the high rates of inflation these days, may be because of the political pressures.  The last hikes have not been effective at all in dealing with the inflationary pressures. And the RBI has fallen behind the curve too as the real rates of interest ( Inflation - Interest ) for borrowers these days have become negative for some time.  

World Markets 

Some emerging markets are also trading strong alongside the Indian markets. Now, some analysts  may again bring out the age old decoupling theory to justify the high valuations of the Indian markets. 


Even if the crash envisaged in the article does not materialize at all, the western economies seem to be set for a long period of slow jobless growth.

The European stock indices, FTSE, CAC and DAX closed in the positive territory on Monday, with gains of  0.72, 0.81 and 0.45 percents respectively. The US market indices closed with strong gains of 0.97 to 1.19 percents on Monday, on the back of better than expected new home sales data.  The more important point to be noted here is that the US indices have closed in the positive territory by the year to date  yardstick. The CBOE VIX index also closed at 22.73, below it's 200 day moving average placed at 23.38,  for the first time in two and a half months.

Updated Momentum Signal Spreadsheet

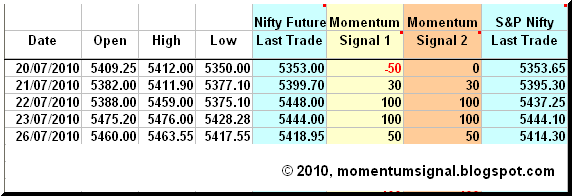
The updated spreadsheet showing the Momentum Signal as on the close of  26th July 2010, is given below.

Even though the future as well as the index closed near the  lows of the day, both of them were able to close in an area which still retained a +50 value of the Momentum Signal.

Projected Momentum Signal Close Values

The projected levels of closing values corresponding to the momentum shift / neutrality / continuation as on the close of trading on 27th July, 2010 are given in the table below. The table also include the projected closing values of BSE Sensex corresponding to the momentum shift / neutrality / continuation signals.
  Please click on the table to enlarge. For more info on the above table,  please click here.  

The trailing stop for all long positions remains at 5360 which is 2.1 % away from the new high. A close below 5352 will lead to the Momentum Signal indicating a sell as on Tuesday.


As the Momentum Signal is primarily a trend following system, it may indicate whipsaw signals in range bound markets. As such, all readers of this blog are requested to read the various pages describing the system and understand all the intricacies of trading the Momentum Signal and it's risk factors too. Please do write in your comments and suggestions.


© 2010, momentumsignal.blogspot.com All rights reserved.

Disclaimer: No research, information or content contained herein or in the accompanied spreadsheet shall be construed as advice and is offered for information purposes only. We shall not be responsible and disclaim any liability for any loss, liability, damage (whether direct or consequential) or expense of any nature whatsoever which may be suffered by the user or any third party as a result of or which may be attributable, directly or indirectly, to the use of or reliance on any information or service provided. All files/information is provided 'as is' with no warranty or guarantee as to its reliability or accuracy.

Sunday, July 25, 2010

Update on The Ultimate Momentum Signal - 26th July, 2010

  A Higher Open, But No Gains On Friday ... !!! 

In spite of the markets reaching new highs on last Friday, the trading remained sluggish and top heavy. The trading interest seemed to be confined to limited number of stocks, especially to the low quality stocks.  These are the classical  symptoms of  an intermediate top.  Traders and investors may consider profit booking  / disposal of the low quality cats and dogs stocks at these times. However, this process of churning can continue for some  more time before any correction may set in.   

Continuing  the positive momentum of last Thursday's late surge, the Nifty futures opened at 5475 and started trading lower. This is becoming a common pattern of trading these days. The futures hit a low of 5428  during the mid-day and closed at 5444.

Nifty Futures - Daily Chart


The Nifty futures have  traded above the supports on last trading day. It has support at the top end of the previous narrow trading range between 5360 and 5410.

S&P CNX Nifty Index -  Daily Chart


Friday's trading has lead to the formation of shooting star doji candles in the daily charts of both the  indices, Nifty and Sensex. These candles indicate selling pressure at the highs, which may lead to reversals. However, the weekly charts of the indices still showed solid white candles for the past week.

The coming week will see some hike in interest rates  by the RBI, quarterly results of the Nifty heavy weights stocks and a derivative expiry which involves the highest amounts of open interest. The Put Call Ratio ( PCR ) seems to be hovering above the 1.50 mark indicating the presence 1.5 puts for every call.  A higher PCR seems to indicate limited downside to the market for the short term, at least in the Indian context.
Updated Momentum Signal Spreadsheet

The updated spreadsheet showing the Momentum Signal as on the close of  23rd July 2010, is given below.

The Momentum Signal has returned a +100 value as last Friday.

Projected Momentum Signal Close Values

The projected levels of closing values corresponding to the momentum shift / neutrality / continuation as on the close of trading on 26th July, 2010 are given in the table below. The table also include the projected closing values of BSE Sensex corresponding to the momentum shift / neutrality / continuation signals.
 
 Please click on the table to enlarge. For more info on the above table,  please click here.  

The trailing stop for all long positions may be set at 5360 which is 2.1 % away from the new high. Even though the market seems to have started the next leg of the rally, the closing values corresponding to sell signals have also increased. 

As the Momentum Signal is primarily a trend following system, it may indicate whipsaw signals in range bound markets. As such, all readers of this blog are requested to read the various pages describing the system and understand all the intricacies of trading the Momentum Signal and it's risk factors too. Please do write in your comments and suggestions.


© 2010 momentumsignal.blogspot.com All rights reserved.

Disclaimer: No research, information or content contained herein or in the accompanied spreadsheet shall be construed as advice and is offered for information purposes only. We shall not be responsible and disclaim any liability for any loss, liability, damage (whether direct or consequential) or expense of any nature whatsoever which may be suffered by the user or any third party as a result of or which may be attributable, directly or indirectly, to the use of or reliance on any information or service provided. All files/information is provided 'as is' with no warranty or guarantee as to its reliability or accuracy.

Saturday, July 24, 2010

Some Speculative Thoughts

 The Stress Test and Some Speculative Thoughts ... !!!

By the time this article appears on the web, readers might have already seen  the  results of the stress test conducted on the European Banks. Yes, out of the ninety one  banks tested, just seven banks failed in the test and those failed banks would require an additional 3.5 billion Euros ( 4.5 billion USD ) capital. 

What are these so called stress tests ? It's just like the scenario analysis used by the intelligence community. The regulators would have calculated what happens to these banks if and when one or two negative market scenarios like a 3 % negative growth in GDP or a 3% fall in prices of sovereign debts,  are played out  in the next two years or so. Obviously, most banks would make some losses but this test would bring out  which banks would be affected more and would require more capital.

Now, readers may ask what is the relevance of these tests on the traders in the Indian market ?

BSE SENSEX - Weekly Chart  


As you can see from the above weekly chart of the BSE Sensex, the Indian markets have been trading in a comparatively narrow range for almost eleven months now. We have also seen four up trends and three down trends which were symmetrical. Let's also do a scenario analysis in which the present pattern continues. In the first scenario, the Sensex is expected to fall from the present area and test the lower support line obtained by joining the lows of the pattern. If this scenario plays out, the Sensex may correct to the 16500 area. The second scenario involves the break of the lower support line of the pattern. In this case the Sensex may correct even to the 14500 area. These two scenarios involve corrections to the magnitude of 10 and 20 % respectively.

Readers may note that these scenarios are not presented here as predictions and there are so many ifs and buts involved when it comes the markets before these scenarios are actually played out. The market may do whatever it likes to do, no matter  what you expect it to do. It is even capable of trapping the maximum number participants when it reverses from the direction to which it is expected to move.        

Even though this article is written with a label "Some Speculative Thoughts" and with so many ifs and buts whistles added, these scenarios are not completely out of the realm of the possible, especially in this era of  "unusual uncertainty". Hence the importance of these stress tests.

It is advisable for all traders to stress test their positions once in a while, especially the leveraged ones ( positions on the margin ) and the derivative positions to find out whether their trading accounts are over stretched and would require additional margin.  For more information  on risk management tools  like money management and  position limits, which help traders from risk of ruin, please click here. 


© 2010 momentumsignal.blogspot.com All rights reserved.

Disclaimer: No research, information or content contained herein or in the accompanied spreadsheet shall be construed as advice and is offered for information purposes only. We shall not be responsible and disclaim any liability for any loss, liability, damage (whether direct or consequential) or expense of any nature whatsoever which may be suffered by the user or any third party as a result of or which may be attributable, directly or indirectly, to the use of or reliance on any information or service provided. All files/information is provided 'as is' with no warranty or guarantee as to its reliability or accuracy.

Friday, July 23, 2010

Update on The Ultimate Momentum Signal - 23nd July, 2010

 Finally, The Decisive Move ... !!! 

Even though the Wall Street tanked overnight on the "unusually uncertain" comments by the Fed Chairman Ben Bernake, the Asian markets did not fall much in comparison with their US counterpart on Thursday morning. Therefore, the Nifty futures opened slightly lower at 5388 on Thursday and tried to test the previous day's lows in the initial hours. By the time the European markets opened without much losses and almost traded flat, the markets tried to test the highs of the previous day. Finally, the markets broke out of the narrow trading range just after the 2 PM mark. The Nifty futures reached a high of 5459 for the day. It closed at a new thirty month high of 5448 for the day. The Momentum Signal has again indicated a buy after going in to the neutral territory for two days due to the flat trading of the markets. 


Nifty Futures - Daily Chart    


As the world markets are also rallying overnight, the market is expected to record new highs. However, traders may also lookout for the repetition of bull traps as happened earlier when the markets achieved new highs as part of slow and grinding rallies. As already been stated many times on these pages, the market may encounter resistance at the 5500 to 5550 levels.

World Markets

The European market indices closed with gains on the back of upbeat corporate earnings. The FTSE, CAC and DAX gained 1.90, 3.05 and  2.53 percents on Thursday. The US market indices were trading with strong gains of 2.10 to 2.50 % at 00.00 Hours IST. The CBOE Vix index was trading at 24.25 which was very near to it's 200 DMA. Any close by the VIX index below it's  200 DMA  at  23.40 will be considered bullish by the market participants.
Updated Momentum Signal Spreadsheet

The updated spreadsheet showing the Momentum Signal as on the close of  22nd July 2010, is given below.
The Momentum Signal has returned a +100 value for the last trading day.

Projected Momentum Signal Close Values

The projected levels of closing values corresponding to the momentum shift / neutrality / continuation as on the close of trading on 23rd July, 2010 are given in the table below. The table also include the projected closing values of BSE Sensex corresponding to the momentum shift / neutrality / continuation signals.

Please click on the table to enlarge. For more info on the above table,  please click here.   

Even though the market seems to have started the next leg of the rally, the closing values corresponding to sell signals have also increased and have reached almost the top end of the previous narrow trading range. 

As the Momentum Signal is primarily a trend following system, it may indicate whipsaw signals in range bound markets. As such, all readers of this blog are requested to read the various pages describing the system and understand all the intricacies of trading the Momentum Signal and it's risk factors too. Please do write in your comments and suggestions.


© 2010 momentumsignal.blogspot.com All rights reserved.

Disclaimer: No research, information or content contained herein or in the accompanied spreadsheet shall be construed as advice and is offered for information purposes only. We shall not be responsible and disclaim any liability for any loss, liability, damage (whether direct or consequential) or expense of any nature whatsoever which may be suffered by the user or any third party as a result of or which may be attributable, directly or indirectly, to the use of or reliance on any information or service provided. All files/information is provided 'as is' with no warranty or guarantee as to its reliability or accuracy.

Wednesday, July 21, 2010

Update on The Ultimate Momentum Signal - 22nd July, 2010

    The Unconfirmed Sell Signal Vanishes, But What Next ... ?

On Tuesday night, the US markets rallied to close with gains, after suffering heavy losses in the beginning of day's trading. By the time the Indian markets opened, the positive momentum from the US markets and the gains from the Chinese markets helped the Nifty futures to open higher at 5382. As is common these days, once the markets traded inside the prevailing trading range for some time, it even tried to test the range's highs too. The Nifty futures a traded to a high of 5411.9 just two ticks away from the Tuesday's high. As the European markets were trading steadily, the Nifty futures meandered inside the present trading range till the end. The Nifty futures closed at 5399.70 on Wednesday. The next direction of the market still seems to be tricky. Most heavy weights in the Nifty index are trading sideways. Now a days the markets are  also trading with the  historical valuations corresponding to previous normal bull markets highs. Hence the sluggish sideways trading. However, the markets still seem to be set for the next decisive move in the next few trading days.


Nifty Futures - Daily Chart 


Any serious weakness in the international markets can still take down the Indian markets to lower levels sooner or later. Even if the markets were to trade higher, the upside seems to be capped to the 5500 to 5550 levels at present, for technical as well as fundamental reasons. 

World Markets 

On back of the overnight positive turnaround by the US markets, the European stock averages, the FTSE, CAC and DAX closed with gains of 1.46, 0.75 and 0.38 percents on Wednesday. The US markets were trading were absolutely flat till 11.30 PM IST.  However, the US markets were moving in to negative territory at the time of this post following the written comments by the Fed Chairman Ben Bernanke in which he said the economic outlook was "unusually uncertain" and the Fed was prepared to take more actions if needed. ( Source : Market Watch ).

Updated Momentum Signal Spreadsheet

The updated spreadsheet showing the Momentum Signal as on the close of  21st July 2010, is given below.


The Momentum Signal has returned neutral values as on Wednesday.


Projected Momentum Signal Close Values

The projected levels of closing values corresponding to the momentum shift / neutrality / continuation as on the close of trading on 22nd July, 2010 are given in the table below. The table also include the projected closing values of BSE Sensex corresponding to the momentum shift / neutrality / continuation signals.
 
   Please click on the table to enlarge. For more info on the above table,  please click here. 
 

Any close below the 5382, 5361 and 17909 by the Nifty Future, Nifty index and the Sensex on  Thursday will result in the system indicating a sell signal. Since the markets are still in the narrow trading  range,  a close below the range is required to confirm the signal.


As the Momentum Signal is primarily a trend following system, it may indicate whipsaw signals in range bound markets. As such, all readers of this blog are requested to read the various pages describing the system and understand all the intricacies of trading the Momentum Signal and it's risk factors too. Please do write in your comments and suggestions.


© 2010 momentumsignal.blogspot.com All rights reserved.

Disclaimer: No research, information or content contained herein or in the accompanied spreadsheet shall be construed as advice and is offered for information purposes only. We shall not be responsible and disclaim any liability for any loss, liability, damage (whether direct or consequential) or expense of any nature whatsoever which may be suffered by the user or any third party as a result of or which may be attributable, directly or indirectly, to the use of or reliance on any information or service provided. All files/information is provided 'as is' with no warranty or guarantee as to its reliability or accuracy.

Tuesday, July 20, 2010

Update on The Ultimate Momentum Signal - 21th July, 2010

   Another Sell Signal, But What Next ... ?

The Nifty Futures opened positively on the back of overnight gains in the Wall Street and the positive cues from the Asian markets on Tuesday. The Nifty futures achieved a high of 5412 at the start of trading itself and thereafter, started the slow grinding downward movement. The down movement accelerated  towards the fag end of trading and the Nifty futures traded last at  5353, very near to the day's low of 5350. The underlying index too closed at 5353.65 on the last trade basis. As the closing prices of the futures and the index are calculated by finding the last half an hour's average price by the NSE, the closing prices disseminated by the exchange are much higher than the last traded prices of  Tuesday. The Momentum Signal has indicated a sell on the basis of the last traded price of the Nifty futures. However, no confirming signal has been available on the basis of the Nifty index and Sensex so far. As already been repeatedly written in the last posts, the market seems to be poised for decisive move in the next few days. At present, the confirmation of the sell signal seems to be most possible outcome.

Nifty Futures _ Daily Chart 


The Nifty future has marginally broken both the support lines. However, the Nifty and Sensex are yet to break their corresponding support lines. The reason for these anomalies are accounted by the changes in the premium and discount in the prices of the futures in comparison with the Nifty index. As already stated in the previous posts, the Nifty futures have minor supports at the 5300 and 5225 levels. These levels are capable of only providing minor supports. At present a larger and deeper correction can not be ruled out too. This is because of the markets inability to go past the previous highs and the fluid economic conditions available in most markets.

World Markets

The European market indices, the FTSE, CAC and DAX closed with losses of 0.17, 0.53 and 0.69  percents. The US market indices opened with deep losses and were on the recovery path  with losses of 0.30 to 0.60 percents at 11.30 PM IST.
Updated Momentum Signal Spreadsheet

The updated spreadsheet showing the Momentum Signal as on the close of  20th July 2010, is given below.


As already discussed, a sell signal has been indicated on the last traded prices of the futures. However this sell signal has not yet been confirmed by any corresponding signals for the Nifty index and the BSE Sensex. However, an exit of long positions were indicated by all the three as on Tuesday. ( In fact the exit  was hinted by the Sensex a day earlier. ) 

Projected Momentum Signal Close Values

The projected levels of closing values corresponding to the momentum shift / neutrality / continuation as on the close of trading on 21st July, 2010 are given in the table below. The table also include the projected closing values of BSE Sensex corresponding to the momentum shift / neutrality / continuation signals.
 
 
Any close below the 5373, 5369 and 17901 by the Nifty Future, Nifty index and the Sensex on Wednesday will confirm the tentative sell signal obtained on the last trading day.  

As the Momentum Signal is primarily a trend following system, it may indicate whipsaw signals in range bound markets. As such, all readers of this blog are requested to read the various pages describing the system and understand all the intricacies of trading the Momentum Signal and it's risk factors too. Please do write in your comments and suggestions.


© 2010 momentumsignal.blogspot.com All rights reserved.

Disclaimer: No research, information or content contained herein or in the accompanied spreadsheet shall be construed as advice and is offered for information purposes only. We shall not be responsible and disclaim any liability for any loss, liability, damage (whether direct or consequential) or expense of any nature whatsoever which may be suffered by the user or any third party as a result of or which may be attributable, directly or indirectly, to the use of or reliance on any information or service provided. All files/information is provided 'as is' with no warranty or guarantee as to its reliability or accuracy.

Monday, July 19, 2010

Update on The Ultimate Momentum Signal - 20th July, 2010


   Another Close in the Trading Range, But What Next ... ?

In spite of the last Friday's losses in the US markets , the Asian markets were trading without heavy losses on Monday. The Nifty futures, therefore, opened at the lower end of the last Friday's trading range. Once the futures traded inside the range for a reasonable time, it even tested the highs of the range as envisaged in the last post. However, it lost the positive momentum again and closed inside the prevailing trading range for the fifth time in six trading days. It seems that the market has spent enough time at this crucial area of  the previous resistance turned support cum trading range. Traders may look out for decisive moves out of the present  trading range in the next few trading days. However a word of caution too ... !  Some of these kinds of moves are susceptible to failures leading to bull / bear traps too ... !

Nifty Futures - Daily Chart  


 World Markets

The European stock indices closed in the negative territory on Monday. The markets in Europe opened with losses and traded in the positive territory for most of the trading day. However, the FTSE, CAC and DAX surrendered their gains in the last hour of trading and closed with losses of 0.20, 0.40 and 0.52 percents respectively. The US markets were trading flat at 11.30 PM IST on the back of waning confidence levels of the home builders.       

Updated Momentum Signal Spreadsheet

The updated spreadsheet showing the Momentum Signal as on the close of  19th July 2010, is given below.


Even though the Momentum Signal has returned a lesser positive value, it has remained in the positive territory for the seventh trading day. As the market has not moved much in the last seven days, "....the chances of the system exiting the present long position either by the activation of the trailing stop or by the indication of neutral  momentum are increasing. " The BSE Sensex has returned a neutral momentum value as on Monday itself due to the weakness in the Reliance stock.

Projected Momentum Signal Close Values

The projected levels of closing values corresponding to the momentum shift / neutrality / continuation as on the close of trading on 20th July, 2010 are given in the table below. The table also include the projected closing values of BSE Sensex corresponding to the momentum shift / neutrality / continuation signals.
 
 
The closing values required for the continuation of the existing long position as on Tuesday have moved upwards and are above the trading range of Monday. The closing values corresponding to a trigger  of the sell signal have also risen. 

As the Momentum Signal is primarily a trend following system, it may indicate whipsaw signals in range bound markets. As such, all readers of this blog are requested to read the various pages describing the system and understand all the intricacies of trading the Momentum Signal and it's risk factors too. Please do write in your comments and suggestions.


© 2010 momentumsignal.blogspot.com All rights reserved.

Disclaimer: No research, information or content contained herein or in the accompanied spreadsheet shall be construed as advice and is offered for information purposes only. We shall not be responsible and disclaim any liability for any loss, liability, damage (whether direct or consequential) or expense of any nature whatsoever which may be suffered by the user or any third party as a result of or which may be attributable, directly or indirectly, to the use of or reliance on any information or service provided. All files/information is provided 'as is' with no warranty or guarantee as to its reliability or accuracy.

Sunday, July 18, 2010

Update on The Ultimate Momentum Signal - 19th July, 2010

    A Gap Down Opening, But What Next ... ?

Last Friday,  the Nifty  Futures opened flat, traded flat and closed slightly in the positive territory on back of the strong gains in the stocks of the IT major TCS.  The market has mostly been trading sideways for the past two days. Most equities are also trading sideways without any momentum, showing the symptoms of a top heavy market. Even though the FIIs were consistently on the buy side for the week, the market has not been able to takeoff. 

The market seems to have hit the top end of the historical fundamental valuation levels achieved during normal bull market tops. ( Click here for an analysis of Nifty historical fundamentals and the Common Sense Guide to Nifty valuations ).  The Historical  P/E, P/B & Div. Yield values of  S&P CNX NIFTY Index as on 16th July, 2010 are given in the table below. The P/E ratio of Nifty at 22.61 is at the top end of the high valuations range between the 20 to 23 range. In fact the Nifty valuation has remained between this range for the first six months of the calender year. 


Nifty Futures - Daily Chart


As expected, the Nifty future has closed mostly inside the support area between the 5360 to 5400 range ( being the previous resistance area ) for the past tree trading sessions. As the US markets have suffered heavy losses on last Friday,  the Nifty future is poised to open gap down on Monday. But what happens next is the most interesting part to the traders. Past experience shows that a market with high positive momentum tries to recover the losses if opened much lower than the previous trading range and if it is traded inside the range, it is even capable of testing the highs of the range. However, a weak market  may open inside or near the previous trading range and then trades lower on further weakness.  Since the Indian market has not yet been able to gain much after the so called breakout above the 5400 levels, it can not be classified as a market with very high positive momentum.

The trailing stop for the existing long positions remains at 5339. The next support for the Nifty future is at the 5300 - 5310 levels. The next lower support is at the 5225 levels. The 50, 100, and 200 day moving averages ( DMAs ) of the Nifty futures were at 5169, 5184 and 5099 on 16th July, 2010.

Nifty Futures - DMA Spectrum   


World Markets

The US markets sold off on last Friday on the back of falling consumer confidence. The yield on two year treasuries has hit a new low on Friday indicating economic weakness ahead.  The US Dow Jones Index has reversed from an area where the 50 and 200 DMAs are placed at present. The possibility of a reversal from this area was discussed  in the post dated 13th July, 2010 on this blog. ( Click here to read the post dated 13th July, 2010 ).

Updated Momentum Signal Spreadsheet

The updated spreadsheet showing the Momentum Signal as on the close of  16th July 2010, is given below.

The Momentum Signal has closed in the positive territory last Friday. A quote from the last update : "....the chances of the system exiting the present long position either by the activation of the trailing stop or by the indication of neutral  momentum are increasing. "

Projected Momentum Signal Close Values

The projected levels of closing values corresponding to the momentum shift / neutrality / continuation as on the close of trading on 19th July, 2010 are given in the table below. The table also include the projected closing values of BSE Sensex corresponding to the momentum shift / neutrality / continuation signals.
  Please click on the table to enlarge. For more info on the above table,  please click here. 
 
As seen in the above table, any close below 5383 by the Nifty future as on Monday leads to the exit of long positions. The closing values corresponding to negative momentum of -50 have also risen and are placed at 5330 and 5314 for the Nifty futures and the underlying index respectively.

All readers of this blog are requested to read the various pages describing the system and understand all the intricacies of trading the Momentum Signal and it's risk factors. Please do write in your comments and suggestions.


© 2010 momentumsignal.blogspot.com All rights reserved.

Disclaimer: No research, information or content contained herein or in the accompanied spreadsheet shall be construed as advice and is offered for information purposes only. We shall not be responsible and disclaim any liability for any loss, liability, damage (whether direct or consequential) or expense of any nature whatsoever which may be suffered by the user or any third party as a result of or which may be attributable, directly or indirectly, to the use of or reliance on any information or service provided. All files/information is provided 'as is' with no warranty or guarantee as to its reliability or accuracy.