An Inside Day Candle !
Yesterday's trading lead to the formation of an inside day candle in the daily charts. Astute traders may note that an inside day candle near the Bollinger Band, and that too after a significant move in any security may, sometimes, indicate a short term reversal. Please read this old post which dealt with the subject of inside candles for more information. However, as matter of abundant caution, it is also stated that these patterns are not foolproof and sometimes these fail too. In case of a reversal triggering, anywhere near the middle average becomes the first target. And in case of the reversal continuing further, the other Bollinger band becomes the next target. Above all, if the pattern fails after triggering a reversal trade, it may indicate the continuation of the previous trend. The daily chart of Nifty Futures given below shows a shaded area as an example of a recent reversal from the Bollinger Band after the formation of two inside day candles. ( Please click on the chart enlarge and examine the previous low. ) However, the short term resistances detailed in the previous post may still act against such a short term reversal, if triggered.
Nifty Futures - Daily Chart

Nifty Options Scene
Nifty Trailing Fundamentals
The trailing Price Earnings Ratio ( PE Ratio ), Price to Book Value ( PB Ratio ) and Dividend Yield ( DY Ratio ) of the Nifty Index were at 18.47, 3.17 and 1.34 respectively as on 11th August 2011. ( More information and a long term analysis on Nifty historical valuation are available from the "Nifty Fundas" page ).
Latest Ultimate Momentum Signal
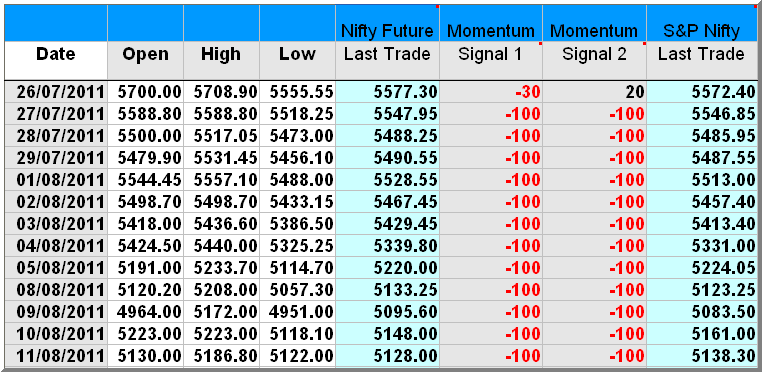
The Momentum Signal has remained in the negative momentum territory as on 11th August, 2011.
Projected Momentum Signal Close Values
The projected levels of Momentum Signal values applicable to various ranges of closing values of the current month Nifty Futures, Nifty Index and the BSE Sensex, as at the next close, ie. as on 12th August, 2011, are given in the following table. All readers are requested to take note that the table below is just a ready reckoner for the next day's Momentum Signal values and the figures are not intended to be interpreted as any targets for the Nifty futures or indices shown therein.

Click on the table above for an enlarged view.
Readers are also requested to go through About, The Signal, Entries and Exits, Position Limits, Risk Factors, Risk Analysis, and FAQs pages to gain a reasonable understanding of the trading system. Please do post your comments and suggestions on how new posts can be made more useful.
Cheers and Prosperous Investing and Trading !!!
To access and/or download the free online Position Limit Calculator click here. ( Please use the latest or updated browsers to access the Google Documents service. )
© 2010-2011, momentumsignal.blogspot.com All rights reserved.
Disclaimer: No research, information or content contained herein or in the accompanied spreadsheet shall be construed as advice and is offered for information and educational purposes only. We shall not be responsible and disclaim any liability for any loss, liability, damage (whether direct or consequential) or expense of any nature whatsoever which may be suffered by the user or any third party as a result of or which may be attributable, directly or indirectly, to the use of or reliance on any information or service provided. All files/information is provided 'as is' with no warranty or guarantee as to its reliability or accuracy. We do not recommend, promote, endorse or offer any guarantee whatsoever in respect of any services or products offered in the advertisements displayed on the site by Google AdSense.
No comments:
Post a Comment