Nifty Future Hangs on the Precipice !
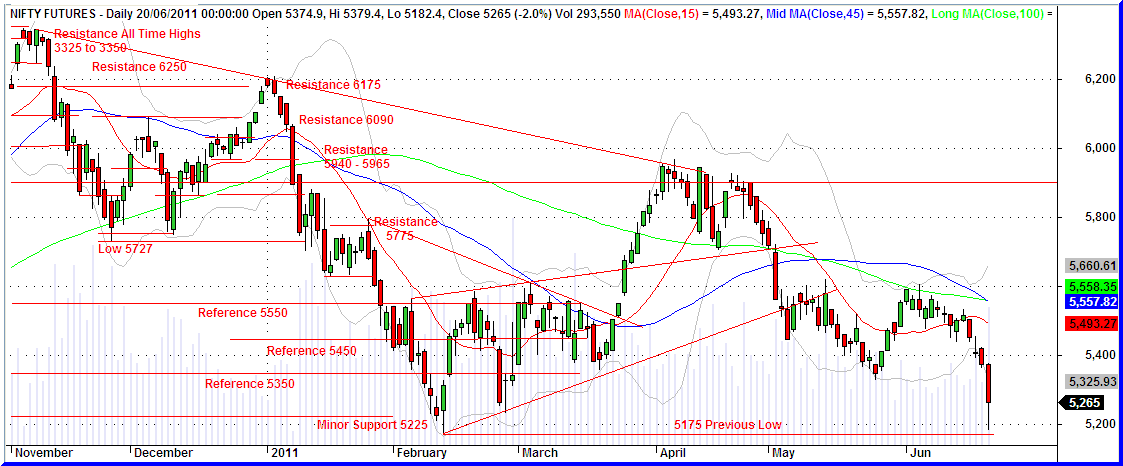
Nifty broke through the 5340 - 5350 support and fell vertically to the next minor support of 5175- 5225 levels yesterday. Nifty has effectively broken out of the one and half year old trading channel in yesterday's trading. ( Please see the weekly chart below. ) Now the question is whether the index is poised for a deep correction or not. Normally, whenever a support or resistance is broken, market has a tendency to retest the just broken support or resistance. Now, Nifty is in the process of testing the broken support at 5350. Therefore, Nifty futures may spend some time between 5175 and 5350 before deciding the next directional movement.
Nifty Futures - Intraday Chart

Nifty Futures - Daily Chart
S&P CNX Nifty Index - Weekly Chart

Nifty Options Scene
The June series Nifty Options Put Call ratio ( PCR June series ) weakened significantly to 0.93 times on Monday.
Nifty Trailing Fundamentals
The trailing Price Earnings Ratio ( PE Ratio ), Price to Book Value ( PB Ratio ) and Dividend Yield ( DY Ratio ) of the Nifty Index were at 19.42, 3.26 and 1.35 respectively as on 20th June 2011. ( More information and a long term analysis on Nifty historical valuation are available from the "Nifty Fundas" page ).
Latest Ultimate Momentum Signal

The Momentum Signal has remained in the negative momentum territory with a maximum negative value of -100 as on Monday.
Projected Momentum Signal Close Values
The projected levels of Momentum Signal values applicable to various ranges of closing values of the current month Nifty Futures, Nifty Index and the BSE Sensex, as at the close of next trading day, ie. as on 21st June, 2011, are given in the following table. All readers are requested to take note that the table below is just a ready reckoner for the next day's Momentum Signal values and the figures are not intended to be interpreted as any targets for the Nifty futures or indices shown therein.

Click on the table above for an enlarged view.
Readers are also requested to go through The Signal, Entries and Exits, Position Limits, Risk Factors, Risk Analysis, and FAQs pages to gain a reasonable understanding of the trading system. Please do post your comments and suggestions on how new posts can be made more useful.
Cheers and Prosperous Investing and Trading !!!
To access and/or download the free online Position Limit Calculator click here. ( Please use the latest or updated browsers to access the Google Documents service. )
Disclaimer: No research, information or content contained herein or in the accompanied spreadsheet shall be construed as advice and is offered for information and educational purposes only. We shall not be responsible and disclaim any liability for any loss, liability, damage (whether direct or consequential) or expense of any nature whatsoever which may be suffered by the user or any third party as a result of or which may be attributable, directly or indirectly, to the use of or reliance on any information or service provided. All files/information is provided 'as is' with no warranty or guarantee as to its reliability or accuracy. We do not recommend, promote, endorse or offer any guarantee whatsoever in respect of any services or products offered in the advertisements displayed on the site by Google AdSense.
No comments:
Post a Comment