google.com, pub-7808368332557457, DIRECT, f08c47fec0942fa0 The Ultimate Momentum Signal: 06/01/2011 - 07/01/2011

Thursday, June 30, 2011

Update for 30th June 2011

   The Up-trend Continues as Expiry is Nearer !

The amazing turn around rally is still continuing without any hiccups so far. There might be derivative expiry related volatility in the afternoon session. As the recovery so far has been very steep, the chances of the market slowing down, especially from tomorrow is there. However, the second rung shares which made almost no recovery in the June series derivatives may start rallying in the next series, as the front liners take a breather. As of now, our expectation of a test of the falling trend line as well as the 200 DMA at around 5700 - 5750 levels remains intact.  


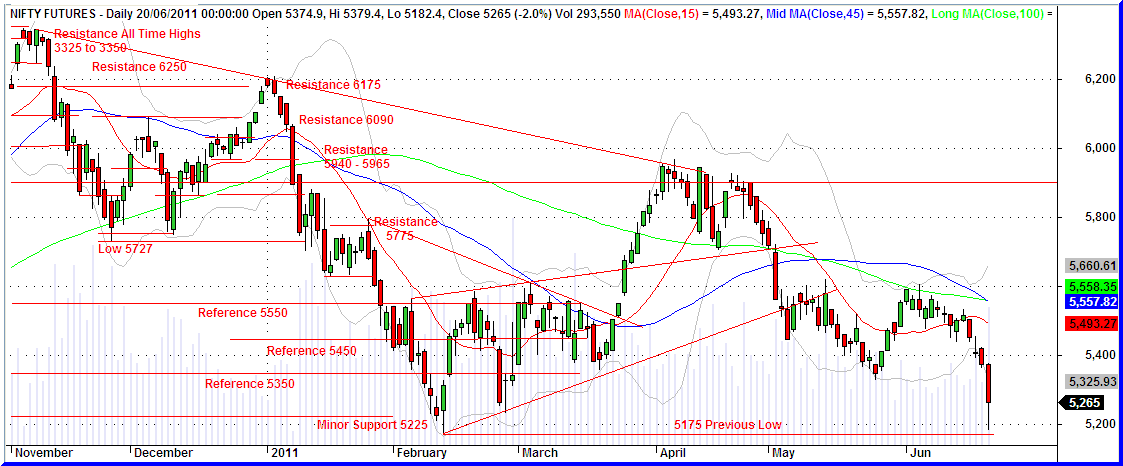
Nifty futures - Daily Chart


Wednesday, June 29, 2011

Update for 29th June 2011


    The Up-trend Continues !

The strong uptrend which started with a bear trap below the 5340 levels is continuing unabated with the Nifty futures contracts already in the gains for a straight fifth day. The contract is also approaching two minor highs at 5610 and 5622. Though the uptrend seems to be on a strong wicket now, it seems that some consolidation is in order as of now.  

Nifty Futures - Daily Chart   


Tuesday, June 28, 2011

Update for 28th June 2011


   Now, the Moving Averages At Play !

After three days of strong gains, Nifty future contracts are taking a breather after encountering resistance offered by the daily moving averages. In fact the 50 and 100 day moving averages ( DMAs ) of the Nifty contracts are in convergence at the 5550 levels. ( Please see the DMAs Chart below for details. ) The 5550 to 5650 area has been an important reference point and has acted both as support and resistance for a long time. As such the it is natural for the Nifty contracts to spend some more time trading at the present range.  Since the present uptrend has started as a reversal after the break of an important support level, the trend may have to continue for some more time with some upside. A break above of the 5550 - 5560 area may help the Nifty futures to test the convergence of 200 DMA and the falling trend line at around the 5725 - 5750 levels.   

Nifty Futures - DMAs Chart


Nifty Futures - Daily Chart


Sunday, June 26, 2011

Update for 27th June 2011


  Back in the Old Trading Channel, Now What ?

After the stupendous rally of last Friday, Nifty index and the futures contracts are already back in the old trading channel. Now, the important question is whether the present bounce is the start of new leg of medium term trend or not. Unfortunately, the answer to the million dollar question will remain unanswered until the market itself reveals it's hands. As the important question remains unanswered, let's examine the key takeaways from the recent market action. Firstly, the old trading channel was broken. Secondly, as the weekly close was inside the channel, let's give the benefit of doubt to the fact that the channel remains intact for the time being. Third, the 5175 - 5200 area has become more important support or reference area because of the double bottom pattern. Fourth, the falling trend line or supply area still remains above the market. Fifth, the horizontal support at 5175 - 5200 area and the falling trend line is showing a descending triangle pattern in the charts. Fifth, until the market closes above the medium term falling trend line and remains inside the channel, the chances of the market breaking the lower end of the channel remains. ( Please see the daily and weekly charts below. ) 


Friday, June 24, 2011

Update for 24th June 2011


 A Recovery is On After the Inside Day Candles !

Contrary to the expectations of a resumption of the downtrend or even a test of the panic low, it seems that Nifty futures contract has started a recovery. Though this author personally didn't believe that the contract would make the recovery, he was forced to comment in the previous post that the formation of two inside day candles in a row might be indicating even a reversal and therefore, the immediate next direction of  the contracts had become highly uncertain. That is why the inside day trading setup was described in the previous post. Now, the recovery is on. As far as the Momentum Signal system is concerned, the last sell signal lead to a maximum favorable excursion ( MFE ) of  319 points in the Nifty futures.  Even if the maximum recommended trailing stop of 2.5 % from the low after the trade was followed, the trade might have lead to profit of  188 points.

  Nifty Futures - Daily Chart    


Thursday, June 23, 2011

Update for 23rd June 2011


  Two Inside Day Candles In a Row, What Now ?

As expected, Nifty futures traded sideways for the entire trading day on Wednesday, in spite of recovery in the international markets. The sideways trading observed during the last two trading days has lead to the formation of two inside day candles in the daily chart of Nifty futures. An inside candle after a fast move is an indication of indecision by the market participants. And sometimes these inside day candles can also indicate reversals and are used as trading setups. Here is a reproduction of an old post which described the inside day candle trading set up. 

How to Trade an Inside Day Candle
  • As this author feels that he is obliged to the readers to at least add a small note on how to  trade an inside day candle, here it is !
            Inside Day Candle- Chart 1

  • The last candles complete range is covered by the immediately preceding candle. Therefore, the last candle is called an inside candle. Please also note that the range of the inside day candle is very small in comparison with the previous candles.
  • In order to trade the inside day candle, place a stop buy order above the high of the candle. 
  •                                                                                                                                                                                    Inside Day Candle- Chart 2
  • Similarly, place another stop sell order at the bottom of the candle.
  • When one of the orders gets executed, the other order becomes the real stop loss order.
  • Manage the trade by adjusting the stop loss or exit  near a known support or resistance.
  • Not every trade may lead to profits and on certain days both orders may get executed leading to losses.

    Nifty Futures - Daily Chart   


Formation of the inside day candles makes the immediate next direction of the Nifty contracts uncertain. Though the medium term trend is downwards, especially after the break of long term support line, markets can even make surprise rallies and test the upper resistances once more before resuming the down trend. However, it seems that the chances of the Nifty futures resuming the downtrend outweighs the start of significant recovery. 

Wednesday, June 22, 2011

Update for 22nd June 2011


 Nifty Futures in Sideways mode ?

As envisaged in the previous post, Nifty future seems to have gone in to a sideways trading mode in which it is in the process of testing the broken support of 5350. As usual, a broken support becomes a resistance and as such, the Nifty contract may find resistance at the 5350- 5400 range on any recovery efforts. Significant put writing was seen in yesterday's trading around the lower support at the 5200 strike. This might offer some support in the short term.  However, the fact of Nifty's break of  the old trading channel remains as a serious technical challenge for the market in the medium term.
  Nifty Futures - Intraday Chart  


   Nifty Futures - Daily Chart    

Note : The chart above shows the edited open and high price of current month Nifty futures contract as the reported open price was at  100 points higher than the realistic actual transactions seen at the open.

Tuesday, June 21, 2011

Update for 21st June 2011


     Nifty Future Hangs on the Precipice !

Nifty broke through the 5340 - 5350 support and fell vertically to the next minor support of 5175- 5225 levels yesterday. Nifty has effectively broken out of the one and half year old trading channel in yesterday's trading. ( Please see the weekly chart below. )  Now the question is whether the index is poised for a deep correction or not. Normally, whenever a support or resistance is broken, market has a tendency to retest the just broken support or resistance. Now, Nifty is in the process of testing the broken support at 5350. Therefore,  Nifty futures may spend some time between 5175 and 5350 before deciding the next directional movement.   

  Nifty Futures - Intraday Chart   


   Nifty Futures - Daily Chart    


S&P CNX Nifty Index - Weekly Chart


Monday, June 20, 2011

Update for 20th June 2011


    Nifty Future Breaks Previous Swing Low !

Nifty future has broken the previous swing low at the time of writing this post on the back of news about the possibility of  amendment of India Mauritius tax treaty.  Mauritius has been the source of at least 30 % of FDI in India and some these have been suspected to be India centric black money. Nifty is at the risk of deep correction if the very minor support of 5175 - 5225 does not hold.

   Nifty Futures - Daily Chart    


S&P CNX Nifty Index - Weekly Chart


Friday, June 17, 2011

Update for 17th June 2011


   Nifty Futures Supported by the 5400 Strike ?

The interest hike by the RBI was more or less on the expected lines and was already discounted by the market. Hence the absence of any severe reaction to the news. However, as envisaged in the previous post, temporary spikes after a lower open happened post the news event. As the event is over, market may go back to it's own low volume listless trading mode, which makes all kinds of analysis much more difficult.  As of now, it seems that the Nifty future is supported by the huge open interest of Put options at the 5400 strike. Though the overall PCR of June series declined on Thursday, it is still above the unitary value and is still away from the very low values associated with very bearish scenarios.  

   Nifty Futures - Intra-day Chart  


  Nifty Futures  - Daily Chart 


Thursday, June 16, 2011

Update for 16th June 2011


     Market Bracing Up for the Rate Hike !

  • On the penultimate day of trading before the expected interest rate hike by the RBI, the interest sensitive stocks sold off and the indices closed at a two week low. 
  • The weakness in the market heavy weight stock Reliance is also adding to the woes of the market.
  • It seems that a 25 basis point hike by the RBI is already discounted by the market. 
  • Any tougher than expected talk by the RBI together with the expected 25 basis point or an unexpected 50 basis point hike can lead to sell off in the market.
  • Even otherwise, market has been lacking both volumes and trading interest for some time and therefore a break form the present trading range can be expected.
  • Overnight losses in the international markets may also add to the negative momentum.
  • However, a lower open and no hike or the expected 25 basis point hike together with some mild talk or an indication of the end of the hike cycle by the RBI may lead to a temporary short covering rally as well.
  • The immediate lower support for the market is at the 5300 to 5350 levels coinciding with the rising long term lower boundary of the trading channel. ( Please see the Nifty Index weekly chart below. ) Though Nifty index has a minor support at the previous swing low of 5175 - 5225 area, the break of the long term support line at the former level may lead to a deep sell off as well. 
   Nifty Futures - Intra-day Chart   


  Nifty Futures  - Daily Chart 


Wednesday, June 15, 2011

Update for 15th June 2011


    Nifty Futures may Remain Range Bound !


Markets have a tendency to trade range bound while awaiting for major events like the mid quarter monetary review of RBI on 16th June, 2011. Even otherwise Indian markets lack any triggers at present. Nifty futures may trade range bound in the above scenario at least till the RBI action.

Readers of this blog are requested to note that the Momentum Signal is prone to make whipsaw signals in ranged markets and the fact is already elaborated in the Risk Factors page.

   Nifty Futures - Intra-day Chart    


  Nifty Futures  - Daily Chart


Tuesday, June 14, 2011

Update for 14th June 2011


   Nifty Futures Remain in the Range !

Though Nifty futures broke the 5480 and 5450 minor supports in the two previous trading sessions, the closes were above or around the 5480 support. These higher closes as well as the very low volumes seen at the lower end of the trading ranges in the two previous trading sessions were actually the symptoms of the earlier indicated recent resilience. As the market has already recovered from the 5400 - 5450 support, now the question is whether the market will remain in the trading range for some more time or try to breakout above the range. Since the market participants are keenly waiting for the impending RBI  action, market is more likely to trade in the present range than trying to make a breakout.   

Readers of this blog are requested to note that the Momentum Signal is prone to make whipsaw signals in ranged markets and the fact is already elaborated in the Risk Factors page.

   Nifty Futures - Intra-day Chart    


  Nifty Futures  - Daily Chart 


Monday, June 13, 2011

Update for 13th June 2011


     Nifty Futures in Downtrend ?

Nifty futures broke the minor support of 5480 on Friday. The contract traveled to the next lower (old) reference level of 5450 and then recovered to close around the support area. As the international markets seem to be entering in to an intermediate term downtrend, Nifty also may also lose the recently seen minor resilience. As a first step, it may revisit the lower boundary of the old trading channel. ( Please see the channel in the weekly chart of Nifty index below.)  The next support areas or reference areas are 5325-5350 and 5175-5225. A break of the lower support of old trading channel may also force the markets losing the long term support  leading to a deep correction.

     Nifty Futures - Intra-day Chart   


  Nifty Futures  - Daily Chart 


Friday, June 10, 2011

Update for 10th June 2011


    Listless Trading Continues !

Nifty future is still trading in the narrow range 100 point range between 5480 and 5580. Though, Wednesday's inside day candle was broken downwards on Thursday, the contract never broke the 5480 minor support. So long as the Nifty contracts trades in the range, the direction of the next move remains unpredictable.

     Nifty Futures - Intra-day Chart    


  Nifty Futures  - Daily Chart 


Thursday, June 9, 2011

Update for 9th June 2011


     Market Losing Ground Again !

Nifty future and major indices closed in the neutral momentum territory as on yesterday. Yesterday's trading was also denoted by an inside day candle in the daily charts. Now, it seems that the market is starting to lose ground again as the low of the inside day candle is broken by the Nifty future. If no recovery is ensuing in the short term, especially from the minor support around the 5480 levels, Nifty future may revisit the lower end of old trading channel.

     Nifty Futures - Intra-day Chart  


  Nifty Futures  - Daily Chart 


Wednesday, June 8, 2011

Update for 8th June 2011


    Market at Crossroads Again !


Nifty future has so far retained some of the recent positive momentum. However, the Nifty index as well as the BSE Sensex has already gone back in to the neutral momentum zone as on Tuesday's close. Any further weakness in the international markets may hamper the present positive move.

     Nifty Futures - Intra-day Chart 


  Nifty Futures  - Daily Chart 


Monday, June 6, 2011

Update for 7th June 2011


Since the power disruption and some technical hitches are continuing, this edition is limited to just the trading system update.


  Latest Ultimate Momentum Signal 


The Momentum Signal has remained in the positive territory as on Monday. 

Projected Momentum Signal Close Values

The projected levels of Momentum Signal values applicable to various ranges of closing values of the current month Nifty Futures, Nifty Index and the BSE Sensex,  as at the close of next trading day, ie. as on  7th June, 2011, are given in the following table. All readers are requested to take note that the table below is just a ready reckoner for the next day's Momentum Signal values and the figures are not intended to be interpreted as any targets for the Nifty futures or indices shown therein.


Click on the table above for an enlarged view.


Readers are also requested to go through The Signal, Entries and Exits, Position Limits, Risk Factors, Risk Analysis,  and FAQs pages to gain a reasonable understanding of the trading system. Please do post your  comments and suggestions on how new  posts can be made more useful.

Cheers and Prosperous Investing and Trading !!!


© 2010-2011, momentumsignal.blogspot.com All rights reserved.

Disclaimer: No research, information or content contained herein or in the accompanied spreadsheet shall be construed as advice and is offered for information and educational purposes only. We shall not be responsible and disclaim any liability for any loss, liability, damage (whether direct or consequential) or expense of any nature whatsoever which may be suffered by the user or any third party as a result of or which may be attributable, directly or indirectly, to the use of or reliance on any information or service provided. All files/information is provided 'as is' with no warranty or guarantee as to its reliability or accuracy. We do not recommend, promote, endorse or offer any guarantee whatsoever in respect of any services or products offered in the advertisements displayed on the site by Google AdSense.

Update for 6th June 2011


 Due to power disruption and some technical hitches this edition is limited to just the trading system update.

  Latest Ultimate Momentum Signal 


The Momentum Signal has remained in the positive territory as on Friday. 

Projected Momentum Signal Close Values

The projected levels of Momentum Signal values applicable to various ranges of closing values of the current month Nifty Futures, Nifty Index and the BSE Sensex,  as at the close of next trading day, ie. as on  6th June, 2011, are given in the following table. All readers are requested to take note that the table below is just a ready reckoner for the next day's Momentum Signal values and the figures are not intended to be interpreted as any targets for the Nifty futures or indices shown therein.
 
 
Click on the table above for an enlarged view.


Readers are also requested to go through The Signal, Entries and Exits, Position Limits, Risk Factors, Risk Analysis,  and FAQs pages to gain a reasonable understanding of the trading system. Please do post your  comments and suggestions on how new  posts can be made more useful.

Cheers and Prosperous Investing and Trading !!!


© 2010-2011, momentumsignal.blogspot.com All rights reserved.

Disclaimer: No research, information or content contained herein or in the accompanied spreadsheet shall be construed as advice and is offered for information and educational purposes only. We shall not be responsible and disclaim any liability for any loss, liability, damage (whether direct or consequential) or expense of any nature whatsoever which may be suffered by the user or any third party as a result of or which may be attributable, directly or indirectly, to the use of or reliance on any information or service provided. All files/information is provided 'as is' with no warranty or guarantee as to its reliability or accuracy. We do not recommend, promote, endorse or offer any guarantee whatsoever in respect of any services or products offered in the advertisements displayed on the site by Google AdSense.

Friday, June 3, 2011

Update for 3rd June 2011


    Market Remains Resilient !


  • Nifty futures and the market as a whole have retained the positive momentum as proved by the new swing highs today morning.
  • We had indicated that if the market does not recover in two trading days, the uptrend might dissipate away. Though market has recovered, it might find resistance just above today's trading range in the 5600 to 5650 area. Please read the post dated 30th May for a detailed analysis.   
    Nifty Futures - Intra-day Chart  


  Nifty Futures  - Daily Chart 


Thursday, June 2, 2011

Update for 2nd June 2011


   Market Spooked by U S Fall !

  • Nifty futures as well as the underlying index almost reached the lower end of the 5600 - 5650 target area described in the post dated 30th May 2011.
  • Yesterday's post had indicated a slow down or a pause in the up trend at the then levels of 5575.
  • Now comparatively large losses in the U S markets have spooked the uptrend and market has opened lower. As the quantum of the U S losses is bigger than normal,  doubts can arise as to the continuation of the up trend.
  • Therefore, if the market is unable to recover in the next two days or so, the uptrend may fail as risk levels are already at high levels because of all round uncertainties prevailing at these times.   
   Nifty Futures - Intra-day Chart 


     Nifty Futures  - Daily Chart  

Wednesday, June 1, 2011

Update for 1st June 2011


  Positive Momentum Remains Intact !

  • The positive momentum remains intact in today's trading too. However, some slow down or a pause in the uptrend may be in the offing.
  • Monday's buy signal has already generated a profitable excursion of 100 points in the Nifty Futures. 
  • As the technical position is unchanged, this update is limited to the very basics.
  Nifty Futures - Intra-day Chart  


      Nifty Futures  - Daily Chart