Nifty Futures Still Stuck in the Trading Range !
- Yeah, there is nothing more to write about except that Nifty future is still stuck in the trading range and that Indian stock market has seemingly attained some kind of resilience. But for how long ? No one knows !
- Following the huge losses in Europe and U S markets overnight, Nifty futures closed lower on Thursday. Many highly oversold stocks gained whereas some of the better stocks lost on Thursday.
- The technical position of the market remains more or less the same and therefore, it seems that no more comments are required ! ( Who wants to read the so called same old market commentaries repeatedly till the market does something interesting ? )
- Market has been spooking the bulls and bears alike for some times now. Now the only question remaining to be answered is whether the market is going to spook the straddle and strangle option writers in the current month or not ? Any breakout by the Nifty either way may lead to a scramble for covering by the option writers !
Nifty Futures - Intra-day Chart
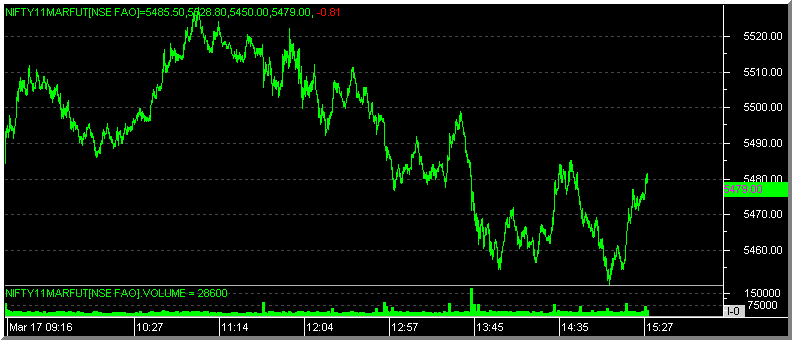
- Thursday's low coincided with the previously indicated reference level of 5450.
Nifty Futures - Daily Chart

Nifty Options Scene
The March series Nifty Options Put Call ratio ( PCR ) decreased to close at 1.25 times on Thursday. Though the Put Call decreased significantly in a single session, the ratio might still be implying a mildly bullish nature of the markets as on Thursday. ( This is unlike the most option literature would suggest. In the Indian context lower PCR is generally associated with market falls and this is just the opposite of many option textbooks suggest. ) The India VIX index gained by 1.49 % following the fall and closed at 25.26. Some Call writing was seen at the 5500, 5600 and 5400 strikes. Some serious covering of Put options were also was seen at the 5400 and 5500 strikes. The 5500, 5700 and 5600 strikes have kept their positions as the strikes with the highest level of March Nifty Call OI as on Thursday. The corresponding strikes for Put OI are 5400, 5300 and 5200. This data may be indicating the possibility of an immediate trading range between 5300 and 5700. The implied volatility of Nifty options as indicated by the India VIX has been hovering in the 20 plus mark for some time even as the market is generally trading range bound. It seems that the improvement in India VIX and the neutral nature of the markets has lead to a situation where the option writers are taking it as a field day for writing straddles and strangles. However, in case of any breakout happening in the market, especially towards the lower side, that might force the option writers running for cover. This might aggravate the condition of the market as seen on the last derivative expiry day.
Nifty Trailing Fundamentals

The trailing Price Earnings Ratio ( PE Ratio ), Price to Book Value ( PB Ratio ) and Dividend Yield ( DY Ratio ) of the Nifty Index were at 20.86, 3.45 and 1.14 respectively as on 17th March, 2011. ( More information and a long term analysis on Nifty historical valuation are available from the "Nifty Fundas" page ).
Latest Ultimate Momentum Signal

The Momentum Signal ended up in the maximum negative momentum territory with sa100 value indicating a sell. However, all readers are once again requested to note that the Momentum Signal trading system is susceptible to whipsaw trades in ranged markets as is being observed now.
Projected Momentum Signal Close Values
The projected levels of Momentum Signal values applicable to various ranges of closing values of the current month Nifty Futures, Nifty Index and the BSE Sensex, as at the close of next trading day, ie. as on 18th March, 2011, are given in the following table. All readers are requested to take note that the table below is just a ready reckoner for the next day's Momentum Signal values and the figures are not intended to be interpreted as any targets for the Nifty futures or indices shown therein.

Click on the table above for an enlarged view.
Please note that the closing level corresponding to a -100 value of Momentum Signal in respect of Nifty futures given in the previous post was erroneous and the mistake is regretted.
Readers are also requested to go through The Signal, Entries and Exits, Position Limits, Risk Factors, Risk Analysis, and FAQs pages to gain a reasonable understanding of the trading system. Please do post your comments and suggestions on how new posts can be made more useful.
Cheers and Prosperous Investing and Trading !!!
To access and/or download the free online Position Limit Calculator click here.
Disclaimer: No research, information or content contained herein or in the accompanied spreadsheet shall be construed as advice and is offered for information and educational purposes only. We shall not be responsible and disclaim any liability for any loss, liability, damage (whether direct or consequential) or expense of any nature whatsoever which may be suffered by the user or any third party as a result of or which may be attributable, directly or indirectly, to the use of or reliance on any information or service provided. All files/information is provided 'as is' with no warranty or guarantee as to its reliability or accuracy. We do not recommend, promote, endorse or offer any guarantee whatsoever in respect of any services or products offered in the advertisements displayed on the site by Google AdSense.
No comments:
Post a Comment