Nifty Future Poised Just Below the 5450 Resistance !
There has not been much happening in the stock markets off recently. Major indices and stocks are mostly trading sideways now a days. There are many reasons for this phase. Here are some of the reasons ! Stocks went northwards in to the realms of expensive valuations in the last quarter of the previous year. Some of the stratospheric valuations have been corrected. The pivotal Stocks are neither cheap nor very expensive at present but most of them are retaining the bull market valuations still. For example, the Nifty trailing Price Earnings Ratio, ( PE Ratio ) has corrected from the near 26 times levels to the 20 - 21 levels at present. The so called mid and small caps have almost seen a bear market by now. Now the uncertainty is about the adverse impact from the rising interest rates and inflation on the corporate profit growth. The small and midcaps are the first ones to fall in the face of any adversity. Now what is the future course ? Markets need conviction about the resumption of unhindered profit growth of around 20 to 25 %. But no such triggers are seen available at present. Therefore, stocks are spending time, trading mostly in a sideways range, waiting for triggers. Until more clarity arrives or valuations become cheaper, stocks may behave like this. No amount of analysis, neither technical nor fundamental, can be of much use in situations like these.
As there is no change in the technical position of the market for the reasons described above, this post is limited to just the usual charts, data and trading system updates. Please read the previous posts for supports and resistance levels.
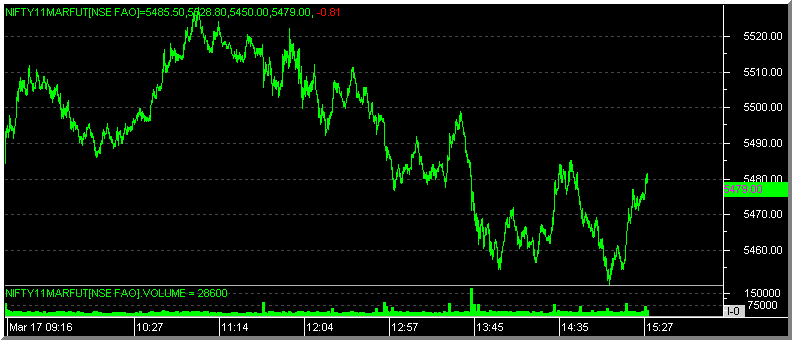
Nifty Futures - Intra-day Chart