Will the Downtrend Continue ?
Pointers :
- The February series Nifty futures closed at 5630 as on last Thursday, the derivative settlement day.
- On last Friday, the first day on which the Feb. Nifty contract became near month, the contract could not even reach the previous day's last traded price of 5630.
- Therefore, the Nifty contracts again made a subtle gap by not reaching the previous day's last trded price.
- These subtle gaps are normally associated with technical weakness, especially in trends and at the highs.
Nifty Futures - Intra-day Chart

- Though the 5550 level was indicated as a minor support, Nifty future could make a bounce of only 30 points from this area.
- However, a bounce seen in the last hour of trading almost reached the 5550 level.
- The 200 day moving average ( DMA ) at 5630 may act as a resistance on any recoveries from now.
Nifty Futures - Daily Chart

- For the next few days, minor supports are available at the 5450 and 5350 levels.
- No supports and resistances are ever permanent, and therefore, these supports are to be confirmed by the market action.
- Since the market has sold off continuously for the last three days, some attempts for recoveries might be forthcoming in the next two days.
- Even if the market crosses the 200 DMA on recoveries, the 5775 - 5800 area may act as a strong resistance for the time being.
Nifty Index - Weekly Chart

- Since the two legs of the down trend has traveled almost similar distances downwards, ( ie 650 points ), some minor recoveries can be expected shortly.
- However, in the medium term, the chances of Nifty index revisiting the lower boundary of the old trading channel are high.
- This lower boundary of the trading channel is at around the 5200 mark at present.
Nifty Index - Monthly Chart

- A bearish engulfing candle has been formed in the monthly chart of the Nifty index in January.
- This may be indicating further weakness in the market.
- The chart also shows the double top pattern and the correction which has occurred.
- Periods in which the market went in to the bubble territory or irrational exuberance are marked by the colored ellipses.
- If the down trend continues in the medium term, most of the so called darling shares of the 2008 boom which have been the laggards and are in the forefront of losers at present may even revisit their bear market lows.
- No one really knows how long the present mild economic slowdown due to the rising inflation, current account and fiscal deficits, interest rates and scandals may last.
- However, one can safely assume that any turnaround in the slowdown may not be near as the deterioration in the economic parameters have only started to be visible now, though the lack of policy initiatives have been felt for sometime.
- Even if the country's economic managers may initiate the appropriate policies for the turn around, it may take another one or two quarters at least before the positive results could be seen.
Now, let's come to the initial question - ' Will the down trend continue ? ' According to the technical and fundamental indications available so far, the answer seems to an 'Yes' at present. However, traders and investors have to consider one more market characteristic here. Whenever most of the analysts and market participants ever come to a consensus about the market, it either reverses violently leading to the failure of the consensus or reaches the consensus target immediately and later on reverse from there. In short, a market with too much consensus is dangerous !
Nifty Options Scene
The February series Nifty options Put Call ratio ( PCR ) remained at 1.22 times on Friday. However, following the sell off in the market, the India VIX closed higher at 22.58, up 2.22 %. The highest numbers of February series Nifty Call option open interest ( OI ) were at the 5800 and 5700 strikes. The highest February series Put options OI was at the 5400 strike as on Friday. Significant additions to the Call option OI were seen at the strikes at 5500 and upwards till 6000. Similarly, Put OI also increased at strikes between 5000 and 5500. This option OI data seems to suggest that market participants are expecting the market to trade in a wide range between 5200 and 5800 in the immediate future. However, these indications may change in accordance with the changes in the market at any time before the expiry.
Nifty Trailing Fundamentals
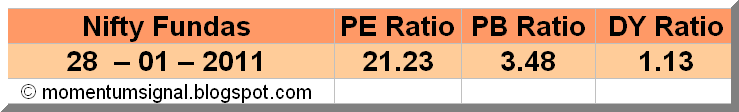
The trailing Price Earnings Ratio ( PE Ratio ), Price to Book Value ( PB Ratio ) and Dividend Yield ( DY Ratio ) of the Nifty Index were at 21.23, 3.48 and 1.13 respectively as on 28h January 2011. Readers may please note that some decrease in the PE multiple is possible at present, due to the increasing profits figures being reported by the corporates in the quarterly results season. ( More information and a long term analysis on Nifty historical valuation are available from the "Nifty Fundas" page ).
Latest Ultimate Momentum Signal

Momentum Signal has again closed at -100 area for the second day in running indicating negative momentum.
Projected Momentum Signal Close Values
The projected levels of Momentum Signal values applicable to various ranges of closing values of the current month Nifty Futures, Nifty Index and the BSE Sensex, as at the close of next trading day, ie. as on 31st January, 2011, are given in the following table. All readers are requested to take note that the table below is just a ready reckoner for the next day's Momentum Signal values and the figures are not intended to be interpreted as any targets for the Nifty futures or indices shown therein.

Readers are requested to go through the The Signal, Entries and Exits, Position Limits, Risk Factors, Risk Analysis, and FAQs pages to gain a reasonable understanding of the trading system. Please do post your comments and suggestions on how new posts can be made more useful.
Cheers and Prosperous Investing and Trading !!!
To access and/or download the free online Position Limit Calculator click here.
To checkout the five year history of The Momentum Signal Spreadsheet click here
Cheers and Prosperous Investing and Trading !!!
To access and/or download the free online Position Limit Calculator click here.
To checkout the five year history of The Momentum Signal Spreadsheet click here
Disclaimer: No research, information or content contained herein or in the accompanied spreadsheet shall be construed as advice and is offered for information and educational purposes only. We shall not be responsible and disclaim any liability for any loss, liability, damage (whether direct or consequential) or expense of any nature whatsoever which may be suffered by the user or any third party as a result of or which may be attributable, directly or indirectly, to the use of or reliance on any information or service provided. All files/information is provided 'as is' with no warranty or guarantee as to its reliability or accuracy. We do not recommend, promote, endorse or offer any guarantee whatsoever in respect of any services or products offered in the advertisements displayed on the site by google adsense.
No comments:
Post a Comment