google.com, pub-7808368332557457, DIRECT, f08c47fec0942fa0 The Ultimate Momentum Signal: 01/01/2011 - 02/01/2011

Monday, January 31, 2011

Update for 31st January 2011


   Will the Downtrend Continue ?


Pointers :

  • The February series Nifty futures closed at 5630 as on last Thursday, the derivative settlement day.
  • On last Friday, the first day on which the Feb. Nifty contract became near month, the contract could not even reach the previous day's last traded price of 5630.
  • Therefore, the Nifty contracts again made a subtle gap by not reaching the previous day's last trded price.
  • These subtle gaps are normally associated with technical weakness, especially in trends and at the highs.

Nifty Futures - Intra-day Chart 


  • Though the 5550 level was indicated as a minor support, Nifty future could make a bounce of only 30 points from this area. 
  • However,  a bounce seen in the last hour of trading almost reached the 5550 level.
  • The 200 day moving average ( DMA ) at 5630 may act as a resistance on any recoveries from now.

Friday, January 28, 2011

Update for 28th January 2011


    A Close Below the 200 DMA, But What Now ?


Following the formation of a bearish engulfing candle on last Tuesday, which indicated further weakness, Nifty futures made further losses on the derivative expiry day and closed below the 200 day simple moving average ( 200 DMA ). However, the February month Nifty future contract closed at 5730 for the day, almost coinciding with the 200 DMA of 5725. This author had indicated in the previous post that the derivative expiry might lead to further market pressures, especially because of the the heavy losses suffered by long position holders in the settlement. It was also indicated that the expiry might be between 5600 and 5700 as per the indications from the Nifty options open interest data. As indicated in the previous post, the market heavy weight Reliance broke the 950 support on Thursday and this factor also contributed for the market's close below the 200 DMA.

Nifty Futures - Intra-day Chart    


Thursday, January 27, 2011

Update for 27th January 2011


   Another Derivative Expiry !!!

Some pointers :
  • A raise of 25 basis points in the interest rates was expected by the market. But why did the markets sell off on last Friday ?
  • RBI has almost abdicated it's responsibility to control inflation by it's act of raising the expected inflation rate to 7 % and doing almost nothing about it except for the prescription of some mild medicine.
  • RBI has dented it's own reputation as an inflation fighter. The central bank has even confirmed that the current inflation cycle will be a long one requiring further hikes down the road.
  • Here is some proof for the ineffectiveness of the rate hikes and of the lethargy of the banking system. The YTM ( yield to maturity ) of 10 year Government securities was quoting at 8.15 to 8.20 % last Friday. Deposit and loan rates of most banks are not much higher than the YTM. Normally, it should be much higher than the YTM of gilts.
  • Need further proof ?  Bankers are crying foul about the lack of deposit growth. Means they are pricing it very low !  And loans are flying off the shelves. Same meaning ! Borrowers are getting the loans dirt cheap !
  • Inflation not only robs the ordinary people but even the corporates.
  • An example : Hindustan Unilever declared it's results on last Friday and the stock sold off by 5 %.  ( Please see the chart below. )
  • Hindustan Unilever is a cash rich company which is just struggling to pass off the high raw material prices.
  • But what happens to other corporates who have heavy borrowings ?
  • They will be negatively  affected on more fronts like raw materials, wages, interest rates etc.
  • In short, corporate profitability growth will suffer.
  • It seems Reliance stock at a three month low might decide the immediate direction of the market. If the stock breaks the 950 support, it may take down the indices lower just because of it's 9.58 % weigtage in the Nifty index. ( Please see that chart below ).   
  •  
Hindustan Unilever ( Inflation Victim ) - Daily Chart


Hindustan Unilever has broken it's 100 DMA support at around the 298 levels. It has support from the 200 DMA at around the 275 levels. The lower supports are at 250 and 225 levels.

Tuesday, January 25, 2011

RBI and Inflation


   Is This Monetary Policy or Non-policy ?


Heard on the Street : Many comments were heard from many sections of the society about an event, which now a days has become a big media circus, especially for the financial media. As is normal now, a big hue and cry is  generated much before, during and after the event. Here are some side comments heard on the street, which,  normally, isn't heard in the open.


  • Thank god it's over, never makes any difference on the ground, but then, why all the hue and cry ?

  • Haven't you heard the saying - ' Every dog has it's day ' ?   It's one of those days on which the nation's accountants get their share of  the media highlight.
  • But, who will bell the inflation cat ?  RBI says it's not their business ? Or what does the expected inflation rate of  7 % mean ?        
  • It  means that they were simply hoping, for the last three years or so, that inflation will go away and they are afraid that their hopes are being belied by this time !  ( BTW, they also buy onions ! )

  • Might be very disappointing to them ?

  • But why ? No one is going to blame the RBI. Besides the FM has given 100 % marks to the non-policy. So far so good and the Guv is enjoying all the attention he can get.

  • Yeah, His Masters Voice !   But what happens to the economy ?

  • Who cares ! Let it go to the dogs !
  • Why are the big fat bankers  talking alarmingly about the liquidity crunch ?
  • Hey, they are showing the withdrawal symptoms and they simply don't want their gravy train to stop ! So, they are not interested to give real interest rates to the depositors either, because it may affect their fat bonuses of both the kinds !
  • What about the business leaders ? They say they are concerned about the diminishing growth ?
  •  Who would like to lose the big set of concessions and the free money ? That is their concern.

Interview with the PM :

Question :  What is your view on the latest money policy ?

PM  :   We consider money as very important and we are still trying to get the maximum details from  the Swiss authorities. But our hands are tied by the various international treaties.  Actually we are at the mercy of them because we can't even do anything about the information we have received so far.  And if you were asking about the 2G money, how can I count the money which the government has not yet received. But I assure that no money received will be left uncounted.


This is one of the last comments heard from the aam admi :


  •  Why on earth this circus is still called a credit policy when in real life, they are robbing whatever is left  in the already empty pocket of mine  ?  Why don't they call it their debit policy ?  


Heard at a party of robber barons ( business magnates, bankers and politicians ) :  


" After all, whose money is it any away ?  Let's all party and rob it till the money lasts !!! " 


© 2010-2011, momentumsignal.blogspot.com All rights reserved.

Disclaimer: No research, information or content contained herein or in the accompanied spreadsheet shall be construed as advice and is offered for information and educational purposes only. We shall not be responsible and disclaim any liability for any loss, liability, damage (whether direct or consequential) or expense of any nature whatsoever which may be suffered by the user or any third party as a result of or which may be attributable, directly or indirectly, to the use of or reliance on any information or service provided. All files/information is provided 'as is' with no warranty or guarantee as to its reliability or accuracy. We do not recommend, promote, endorse or offer any guarantee whatsoever in respect of any services or products offered in the advertisements displayed on the site by google adsense.

Update for 25th January 2011


  Is This the Start of an Uptrend ?


After spending an entire week for trading inside a narrow trading range, Nifty futures finally tried to rally and test the upper resistances. Though the Nifty contracts couldn't surpass the 5775 resistance area on Monday, at the very least, it tested  the previous weeks' high of 5754 and closed at 5741. Intra-day volatility levels  also  lessened on Monday to levels which is normally seen in slow rallies. The surprising fact is that the rally was actually lead by the interest sensitives and the laggards were Reliance, Bharti, Wipro etc.

Nifty futures opened flat and tried to test the previous inside day's high, right in the morning session. Once the previous day's high was taken out, the nifty contracts  tested the previous week's high. A small intra-day correction saw the Nifty futures revisiting the previous day's high in the middle of the trading session. The close was near the high of the week long trading range.

Nifty Futures - Intra-day Chart    


Sunday, January 23, 2011

Update for 24th January 2011


 To Be or Not To Be ?

Yeah, " To be or not to be " seems to be the most important question facing the market as well as the market participants in the coming week !  For example : By the end of the previous week, it seemed that the market itself is facing the question - ' To Rally or Not to Rally ' or " To Fall or Not to Fall Further '.  It seems traders and investors are also befuddled by the sideways trading seen in the previous week. Moreover, RBI will also be finding the answer to it's own similar question - ' To Raise Interest Rates or Not to, and if yes, by how much ? ' All these and a midweek trading holiday, just before the expiry of a series in which one side of the market has already suffered heavy losses,  may make any attempt to analyse the complex and unfathomable situation a friutless affair. Therefore, let this author use some straight talk. It's simple !  This author does not have the slightest idea about what the market may do in the coming week.  But, this author has a piece of advice which could help in such situations - Simply stay away from the market till some clarity ( not of any absolute variety but some relative clarity, because markets never provide the absolute variety ! )  arrives !.  Well this is not the opinion of this author alone !. This is the message given by the market itself through  it's sideways movements as seen in the charts. This is a usual process through which markets undergo when expecting some significant price moving news or events.

 Nifty Futures - Intra-day Chart     


Friday, January 21, 2011

Update for 21st January 2011


Another Intra-day Bounce, But What Now ?


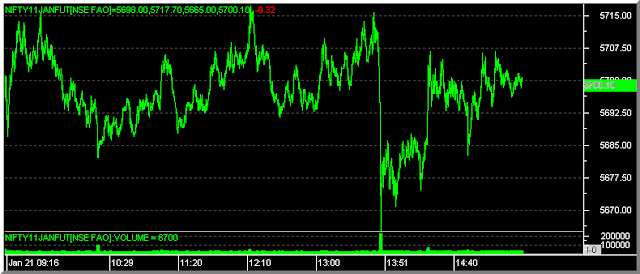
We used the title " A Tentative Close, But What Now " for the last post, because of the peculiar nature of market close seen on Wednesday. We said that, though the bearish engulfing candle may be indicating an immediate down move, the tentative close might be an indication for a move in either direction. Therefore, traders were advised to be extra careful and alert for fast movements in either direction on Thursday or the following day. Nifty futures opened below the previous day's trading range due to the negative international cues on Thursday. The futures contract tried to recover, but the move failed at around the 5680 mark. Another tentative down move saw the contract almost revisiting the recent swing lows. However, the tentative down move in the morning session also lacked volumes. Therefore, the ensuing recovery  actually  became a frantic short covering rally which traveled around 100 points in just one and a half hours. Nifty futures closed at 5722 after recording a high of 5744.


 Nifty Futures - Intra-day Chart


Thursday, January 20, 2011

Update for 20th January 2011

  A Tentative Close, But What Now ?

We had opined in the previous post that the present up move from just about the 200 DMA seemed to a tentative one and lacked enthusiasm.  Wednesday's down move has vindicated that opinion. On Wednesday, Nifty futures opened flat at 5740 and almost immediately went on to retrace the small up move it made in the last half an hour of the previous trading day. After recording a low around the upper range ( 5710 ) of the previous day's intra-day narrow trading range, the Nifty contracts tried to rally again tentatively. It recorded a high of 5754 in the middle of the day. However, a break of the rising trend line seen in the intra-day charts of the contract, saw another bout of sudden selling made apparently by the day traders. Nifty futures fell to 5661 in this bout of selling, but recovered to close at 5697 for the day.


Nifty Futures - Intra-day Chart


Wednesday, January 19, 2011

Update for 19th January 2011

    Will the Tentative Up Move Continue ?

Following the formation of a narrow range inverted hammer candle on Monday, Nifty futures opened higher on Tuesday as expected. We had indicated in the previous post that the inverted hammer candle may be indicating a minor or a major reversal from an area which is just above the 200 DMA. Nifty futures opened at 5678 and almost immediately went on to test the immediate higher minor resistance at 5725. The Nifty contracts corrected from there to record the day's low of 5772 in the morning session itself. Nifty futures spent most of the trading day between 5680 and 5710 before moving upwards in the last half an hour of trading. The up move seemed to be a tentative one and was lacking much enthusiasm. ( Well this is a personal opinion and such opinions can  be wrong also. )

 Nifty Futures - Intra-day Chart


Tuesday, January 18, 2011

Update for 18th January 2011

     Market Takes a Breather,  But Will It Reverse From Here ?

If you were a Nifty futures trader, almost nothing of any significance happened in the markets on Monday. In fact, the market took a breather on Monday lead by the pivotals, after falling 200 points in just two and a half hours of trading on last Friday. Nifty futures opened at 5640, slightly below the previous close on Monday. But after establishing a low of 5629, which is just above the 200 DMA levels, the futures contracts remained in a comparatively narrow trading range for the entire trading day. Nifty futures established an intra-day high of 5705, but the close was at 5660. However, most stocks continued their down moves on Monday as indicated by the very negative advance decline numbers.


 Nifty Futures - Intra-day Chart

Monday, January 17, 2011

Update for 17th January 2011

 
     How Far Can the Market Go Down ?

Some of the Investors and traders might be curious why such a negative headline as the above one is being used on this site when so many investors and traders might be having heavy losses.  Well, let  this author make it clear !  It's not about being negative. It is just the outcome of an attempt to become neutral, objective and also to avoid the foolish bullheadedness. Let me make it clear once more with some explanation. Markets are falling now because of the simple reason that the markets went too far or overboard on the way up and was not actually supported by the fundamentals. Even after the fall of about 12.5 % from the highs, Nifty index is still quoting at a relatively high historical trailing price earnings multiple of 22.5 as on 14th January 2011. It is a simple fact that this level of high valuations is not sustainable on the face of slowing profit growth. Readers interested in a simple analysis of long term historical trailing valuations of Nifty index may click here to check out the Nifty Fundas page on this site. Further, if anyone is still not happy with the explanation for the fall, suffice it to say that these outcomes were twice discussed and the necessary warnings were made on this site in the posts dated August 22nd and September 9th of last year.

Coming back to the original question - How far the markets can go down, the correct answer is beyond the reach of anyone at present. Therefore, let's check the charts of various time frames to reach a best guessed answer to this question. But, let's check out the latest market action first.

We had indicated in the last post that "according to the available indications so far, the chances of the market breaking the 5700 mark is higher than a recovery from this level for various reasons. "
 
Nifty Futures - Intra-day Chart 


Friday, January 14, 2011

Update for 14th January 2011

     Will the Down Trend Continue ?


In the previous post we advised that traders may again look for short trades after the completion of  the bounce. This is a quote from the update for 12th January, which was also reproduced in the last post ." In case Nifty futures breaks above the immediate resistance area of 5850 to 5865, we may expect a rally even to the 5940 to 5950 area. However, such a rally will not be sufficient, to prove conclusively that the the down swing has ended, given the lack of interest shown by the FIIs on loading up the expensive Indian equities in the new year. Hence, traders may again look for short trades after the expected bounce."  

The last post also added the following : " .... option OI data seems to suggest that another down move is still possible towards the 5600 strike, on the completion of the present short covering rally."  

Therefore, anyone following the regular updates of the Momentum Signal trading system  could  have again  made a profit of around 100 points in the Nifty futures, by entering in to a short trade at or near the indicated resistance at 5865. 

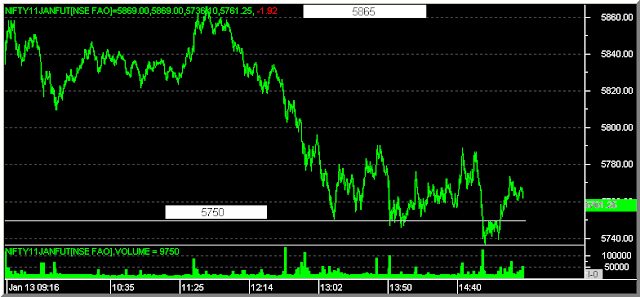
Now, let's check the market action of Thursday. On Thursday morning, Infosys declared it's less than expected ( even though it seemed that the fault was with the analysts ! ) quarterly results . Infosys and the IT pack were the strongest group of equities in the indices and the last hope of the bulls. Once the market heavy weight Infosys lost more than 3 % at the opening, the bounce back failed at the first resistance of 5865 itself. Therefore, Nifty futures sold off  to the 5750 area and closed at 5761.

Nifty Futures - Intra-day Chart 

Thursday, January 13, 2011

Update for 13th January 2011

     Another Rally As Expected !


In the last post we had indicated that traders may look for counter trend long trades  in the Nifty futures, especially, on declines towards the 5750 area, because of the highly oversold nature of the markets.and a price rejection at the lower levels. This suggested trade alone would have made an intra-day profit of  more than 100 points in the Nifty Futures. On Wednesday morning, Nifty futures opened flat and as expected, traded lower towards the adjusted closing price of the previous day. This probe went as low as 5711 on the back of the lukewarm economic data.   In spite of the relatively bad IIP numbers, markets staged a fine rally from the three month lows, as expected. 

But before examining the charts, here is an update of the short trade initiated in accordance with the Momentum Signal Trading system. Even if all the rules of the system were followed exactly and the trailing stop was setup at 5840, the last trade would have made a profit of 55 points in the Nifty futures. The trade generated a maximum favorable excursion ( the distance to the maximum profitable area  or low after the short trade ) of 196 points in the Nifty futures. Since the support around the 5725 to 5750 area was  known, a trader could have exited with a profit of at least 150 points in the Nifty futures.  The day's market action is seen in the intra-day of the Nifty futures below.

Nifty Futures - Intra-day Chart  


Wednesday, January 12, 2011

Update for 12th January 2011

    Finally, A Break to the Free Fall ?

After the non stop free fall of the past five days, investors and traders were hoping at least for a break, when the markets opened on Tuesday. Nifty futures opened slightly higher and immediately traded upwards to the 5825 levels. However, trading mainly remained range bound  between 5800 and 5830, till around 2.00 PM. The outer ranges of this trading range were between 5770 and 5840. Trading seemed to be a low key affair till the 2.00 PM mark. The European markets opened at 1.30 PM with gains and were trading steady. But, instead of acting in accordance with the positive cues from the international markets, Nifty futures started to drift slowly towards the lower area of the trading range. However, the drift which started as a normal test of  the lows became a deluge of sudden selling. Nifty futures easily broke through the then day's low of 5770 and also the previous day's low of 5746. The contract even broke the three month low of 5727. It recorded a low of 5700 before any semblance recovery was indicated. A notable feature of Tuesday's trading was the fact that the Two major indices, Nifty and BSE Sensex never broke their respective November lows. The sudden down move reversed from the 5700 and 19000 levels of Nifty and Sensex respectively. The recovery from these levels were also as dramatic as the free fall. The free fall of 120 points and an equivalent recovery took just one and a half hours. The close was at 5808.  Before dealing with the next possible outcomes of this swing, let's check the charts.

 Nifty Futures - Intra-day Chart  


Tuesday, January 11, 2011

Update for 11th January 2011

   How Long the Free Fall  will Continue ?

How long the free fall will continue ? This is the question faced by investors and traders on the close of the trading as on Monday, 10th January, 2010. Nifty futures have fallen by 313 points  ( 5.15 % ) in the last two days without any meaningful pullback whatsoever. And it's been a long time since the market has seen such  uni-directional moves. The market has also lost continuously for the past five trading days. It seems that the FIIs ( read fund managers ) were just waiting for January to arrive before starting a bout of profit booking, after securing their year end bonuses. It seems that the floodgates of FIIs selling are open now. The free fall of the market observed in the last two days seems to indicate that the low of 5727 recorded by the Nifty futures in November and again reinforced by the December low of 5748, may not hold in the new year.  If these lows do not hold, where are the lower supports ? Let's check the various charts before trying to find an answer.

Nifty Futures - Intra-day Chart   


Sunday, January 9, 2011

Update for 10th January 2011

      The Strong Stocks too Join the Bandwagon ?

It was common knowledge that banks and other interest sensitives were weak and the market was being held up by some strong stocks from a few sectors like, IT, FMCG, Pharma and some selected commodity stocks. Therefore, the best case scenario for the Indian stock market in the short term was a period of sideways to positive trading, in which period, the growing fundamentals may justify the extant high valuations of the pivotals. However, no one could have anticipated the kind of the capitulation seen on last Friday in the Indian stock market. By hindsight, we can attribute the gains achieved in late December, which also came with very low volumes, to those fund managers who wanted to ensure their fat year end bonuses and nothing more. Now, the Indian stock markets are certainly under performing most other stock markets because of the internal problems faced by the economy and due to the relatively high historical valuations. I had written in the very first post of this year that "the Indian stock markets are still quoting at relatively higher historical  valuation levels due to the perceived growth potential and ....the fundamentals of Indian stock markets may be affected by the tight liquidity, rising inflation and interest rates, political instabilities, the ever decreasing standards of governance both at the corporate and political spheres etc, albeit in phases." But while writing that post, I never expected that the market may encounter the roadblocks within such a short time !

Friday's Market Action :  Nifty futures opened slightly lower at 6065 and just managed to touch the previous day's last traded price. Thereafter, the contract started to drift slowly towards the lower supports or reference points. As usual,  the bank stocks sold off initially. Nifty futures managed to stay above the 6030 level in the initial stages. However, the break of this minor support saw the futures testing the next minor support at 6000 and staying between 6000 and 6030 for the next two hours or so. Once the 6000 mark was broken, the decline accelerated and Nifty futures reached a low of 5891 in the last half an hour of trading. The important point noted was that the contract never got any meaningful support at the 5940 level. The contract closed at 5896 for the week.


Nifty Futures - Intra-day Chart   


Friday, January 7, 2011

Update for 7th January 2011

      Market Loses Further Ground, But What Now ? 

As suspected and also indicated in most posts of this year, the banking sector and the interest sensitives  like the autos and capital goods stocks are becoming road blocks for the new year rally. Nifty future opened slightly higher at 6130 on Thursday. But the contract sold off immediately at the open, to reach the reference level of 6090. It spent some time above the 6090 level but, on the back of further losses in the banks, it broke the minor support at the 6080 to 6090 levels. However, the fall seemed to cushioned on the back of some strength seen in the market heavy weights Reliance, Infosys, TCS etc. We had indicated  in the previous post that if the major stocks continue to move in diverging directions, Nifty futures may trade sideways also. Nifty futures recorded a low of 6046 in a slow probing move in a market of diverging stocks but recovered to close at 6070 for the day.  

Nifty Futures - Intra-day Chart   


Update on State Bank of India

       Bear Raid on SBI !
 
The last post itself was titled 'The New Year Party's Over ?' indicating further loses on Thursday. The banking sector lost further on Thursday. As a matter of fact, the SBI stock has closed below it's 200 day moving average for the first time in eleven months.  


State Bank of India - Daily Chart with DMAs


SBI has broken the two year old support line ( see the top panel of the chart as well as the weekly chart below ) two days back and has closed below below it's 200 DMA of 2662 as on Thursday. The next major supports are seen at the 2400, 2300, 2200 and 2000 levels. This update is not published as a trade recommendation but to remind long term investors that SBI would be good pick at around the 1800 to 2000 levels if available.


SBI  Weekly Chart


The weekly chart of SBI shows the break of the long term support line which originates from the start of this  bull phase in March 2009. 

We had indicated many a times in the past ( please see the links below ) that RBI has not been effectively managing the rising inflation expectations in the economy and this factor may turn out to be road block to the bull market. We had also purposefully omitted recommending the SBI stock in the last edition of Nifty heavy weights because of the expected rise in interest rates. 


Nifty Heavies Revisited !

© 2010-2011, momentumsignal.blogspot.com All rights reserved.

Disclaimer: No research, information or content contained herein or in the accompanied spreadsheet shall be construed as advice and is offered for information and educational purposes only. We shall not be responsible and disclaim any liability for any loss, liability, damage (whether direct or consequential) or expense of any nature whatsoever which may be suffered by the user or any third party as a result of or which may be attributable, directly or indirectly, to the use of or reliance on any information or service provided. All files/information is provided 'as is' with no warranty or guarantee as to its reliability or accuracy. We do not recommend, promote, endorse or offer any guarantee whatsoever in respect of any services or products offered in the advertisements displayed on the site by google adsense.

Thursday, January 6, 2011

Update for 6th January 2011

       The New Year Party's Over ?
 

Banks played spoil sport for the second day in succession on the back of the increasing awareness in the market about the need for further increases in the interest rates in the economy. We had indicated in the previous post that any more damage to the charts of the banking sector sector stocks would seriously affect the present uptrend itself in the new year. It seems that the time  to decide the fate of the present uptrend  has arrived by now. Any further decline in the Nifty futures might force the Momentum Signal system to indicate an exit of long positions.

Nifty futures opened slightly lower on Wednesday at 6151 and this open became the high of the day later on. Almost immediately on the open, Nifty futures went to trade below the previous day's low and never tested the open. The contract traded in a tight range between 6120 and 6140 for most of the morning session. It broke below the 6120 mark and tested the previously indicated reference level of 6090 in the afternoon. It recovered to 6120 from the support at 6090, but closed lower at 6098 for the day.

Nifty Futures - Intra-day Chart    

Wednesday, January 5, 2011

Update for 5th January 2011

    Banks Spoil The New Year Party !!!

On the second trading day of the new year, Nifty futures opened slightly higher on Tuesday, when almost all international stock indices were trading with gains. We had indicated in the last post that the unusually low volumes seen on Monday, might be raising some questions about the  strength  of the present uptrend. It was also indicated in one of the previous posts that the rising interest rates may affect the banking sector and the Indian economy as whole. It seems that, these two factors were seen in action in Tuesday's trade, as Nifty futures started to correct right from the beginning of trade. Nifty futures recorded the day's low of 6147 by the 11.30 AM mark. A recovery in tandem with the gains in the FTSE index ( which did not trade on Monday when all other markets gained ) saw the futures reaching a new swing high of 6210. However, the contract was again sold off on the back of the all round weakness in the banking sector. Nifty futures closed at 6159 for the day.


Nifty Futures - Intra-day Chart     


Tuesday, January 4, 2011

Update for 4th January 2011

   A Late Edition of the Momentum Signal Update 


  • As indicated in the previous update, this post is published late, due to some unavoidable exigencies.
  • Even though Nifty futures closed higher on the first day of trading in the new year, the volume and open interest seemed to be unusually low in comparison to similar trading days, raising some doubts about the present uptrend.
  • Rising interest rates and tight liquidity conditions seem to be taking it's toll on the banking sector in today's trade. ( Please note that this possibility was indicated in the one of the previous posts. )
  • As the Nifty future had registered positive closes on the previous four trading days, today's losses can be considered just as a minor correction for the time being. However, this opinion requires revision in accordance with further market action. 

Nifty Futures  - Daily Chart 


As there is no change in the technical position of the market, the following sentence dealing with the important reference points is reproduced from the previous post. "The next higher resistance is at the 6250 level at present. The lower supports are available at the 6090, 6030 and 6000 levels. Therefore, the important reference levels available for intra-day analysis and trading are 6000, 6030, 6090, 6130, 6175, 6250 and 6330."

Nifty Options Scene
The January series Nifty options Put Call ratio decresed slightly to 1.59 as on  3rd January, 2011.

Nifty Trailing Fundamentals     

The trailing Price Earnings Ratio  ( PE Ratio ), Price to Book Value ( PB Ratio ) and Dividend Yield ( DY Ratio ) of the Nifty Index  were at 24.57,  3.88 and  1.01  respectively as on  3rd  January 2011. ( More information and a long term analysis on Nifty historical valuation are available from the "Nifty Fundas" page ). 


Latest Ultimate Momentum Signal

The updated Momentum Signal spreadsheet showing the latest signal values of the current month Nifty future and the Nifty index is given below :
  

Nifty futures and both the indices, viz. S&P Nifty and BSE Sensex have closed with Momentum Signal values of +100 as on the first day trading of the year 2011.


Projected Momentum Signal Close Values

The projected levels of Momentum Signal values applicable to various ranges of closing values of the current month Nifty Futures, Nifty Index and the BSE Sensex,  as at the close of next trading day, ie. as on  4th January, 2011, are given in the following table. All readers are requested to take note that the table below is just a ready reckoner for the next day's Momentum Signal values and the figures are not intended to be interpreted as any targets for the Nifty futures or indices shown therein.
 Please click on the table to enlarge. For more info on the above table,  please click here.


Readers are requested to go through the Risk Factors, Risk Analysis, Position Limits and FAQs pages to gain a reasonable understanding of the trading system. Please do post your  comments and suggestions on how new  posts can be made more useful.
 
Cheers and Prosperous Investing and Trading !!!

To access and/or download  the free online Position Limit Calculator click here.

To checkout the five year history of The Momentum Signal Spreadsheet click here
 
© 2010-2011, momentumsignal.blogspot.com All rights reserved.

Disclaimer: No research, information or content contained herein or in the accompanied spreadsheet shall be construed as advice and is offered for information and educational purposes only. We shall not be responsible and disclaim any liability for any loss, liability, damage (whether direct or consequential) or expense of any nature whatsoever which may be suffered by the user or any third party as a result of or which may be attributable, directly or indirectly, to the use of or reliance on any information or service provided. All files/information is provided 'as is' with no warranty or guarantee as to its reliability or accuracy. We do not recommend, promote, endorse or offer any guarantee whatsoever in respect of any services or products offered in the advertisements displayed on the site by google adsense.

Sunday, January 2, 2011

Update for 3rd January 2011


  Will the Uptrend Continue in to the New Year ?

In the last day of trading in the just gone by year, Nifty futures closed at a new swing high. As expected, Nifty futures tested the 6175 - 6180 resistance and closed just below these levels. As for the title question, 'Will the uptrend continue in to the new year ?'  - the answer is as uncertain as ever. And nobody ever knows for sure what exactly the market may do in any time frame but for some generalisations. What we, the traders, can do at best, is to follow the market day by day and come to the best conclusions, which may or may not become correct by hindsight.  That is why we are forced to follow a system of trading and go by the evidence thereof. This is exactly where the Ultimate Momentum Signal trading system helps the traders. The system assumes that the uptrend continues until the system signals an exit or reversal. 

Please note that the next update will be published a bit late but hopefully before the  end of  trading on Tuesday, the 4th of January, 2011.
 

Nifty Futures - Intra-day Chart   


Nifty futures opened at the previous close of the January series at 6131 and almost immediately went on to rally to the next indicated resistance at the 6175- 6180 area. However the close was slightly lower at 6164.

Some Thoughts on Investments and Trading

  A New Year and New Hopes !!!
 

This is time of the year when the new year begets with lot of hopes and dreams ! This is the time of the year when people make all kinds of new year resolutions and forget about it later on !!  Let this author once again wish all the readers a very happy and prosperous new year !!  

And this is the time of the year when all analysts and traders publish their stock picks and trades for the new year, with very high levels of hope. However, this author is forced to add a small note of caution that investors and traders may remain careful, because many known and unknown roadblocks  may hinder the smooth flow of the Indian bull market at any time, especially in the shorter time frames. We are living in a world which has become so interconnected, as anything which happens at any part of the world may augment in to a financial tsunami of mass proportions. Even though the western and US equities are still cheap on a historical basis, even at their two year highs,  some analysts are still skeptical about the recovery, because of  the jobless growth and the impending reset of interest rates on a lot of mortgages in the second half of the year 2011.  Besides investor optimism seems to have risen to new highs. Some banks and even some countries may  be  required to be bailed out again. 

The Indian stock markets are still quoting at relatively higher historical  valuation levels due to the perceived growth potential. For an example of short term hindrances, at least six Indian banks have raised their interest rates over the new year weekend. The RBI, after falling behind the curve at least by an year, will be forced to raise interest rates further in to the new year.  The fundamentals of Indian stock markets may be affected by the tight liquidity, rising inflation and interest rates, political instabilities, the ever decreasing standards of governance both at the corporate and political spheres etc, albeit in phases.  

Let us end this post on a note of hope. Many analysts might be doling out big index targets at these times of the year like Nifty at 25,000 etc. Let this author make it clear that Nifty or for that matter, any other investment which earns a 15 % yearly compounded return can reach 24,800 from 6130, in just ten years. Similarly, Nifty can reach 9990, 15900 and 37950 at the yearly compounded returns of 5, 10 and 20 percents  respectively. But no stock market ever goes straight up and there will be many periodic obstacles at the stock and industry levels and the Indian and world economy  as a whole. These will  give good opportunities for knowledgeable and patient investors and traders alike. Let us hope that the best managed Indian companies can make a compounded return of 20 % p.a. in the new decade !  However, this is where all the caution is to be exercised by the investors. Many studies have shown that most investor portfolios do not make or match even the returns of broad stock indices. Investing in an exchange traded fund which tracks the Nifty index like 'Nifty Bees' or sticking to the best large caps of the Indian economy seems to be an ideal solution at present.  Let us also hope that the Indian stock market grows and delivers in the new decade ! But when it comes to trading and stock markets, it is always better to say  : " Hope for the best, but prepare for the worst  !!! "  Hence this note of caution.

Cheers and Prosperous Investing and Trading !!!  

Keywords : Large capstocks, ETF, Stock returns, Long term compounding etc.  

© 2010-2011, momentumsignal.blogspot.com All rights reserved. Disclaimer: No research, information or content contained herein or in the accompanied spreadsheet shall be construed as advice and is offered for information and educational purposes only. We shall not be responsible and disclaim any liability for any loss, liability, damage (whether direct or consequential) or expense of any nature whatsoever which may be suffered by the user or any third party as a result of or which may be attributable, directly or indirectly, to the use of or reliance on any information or service provided. All files/information is provided 'as is' with no warranty or guarantee as to its reliability or accuracy. We do not recommend, promote, endorse or offer any guarantee whatsoever in respect of any services or products offered in the advertisements displayed on the site by google adsense.