google.com, pub-7808368332557457, DIRECT, f08c47fec0942fa0 The Ultimate Momentum Signal: 2011

Tuesday, August 23, 2011

Update for 23rd August 2011


Finally Some Recovery ! 

Here is another bare minimum update of the Momentum Signal trading system.

   Nifty Futures Daily Chart 


 Nifty Trailing Fundamentals  


The trailing Price Earnings Ratio  ( PE Ratio ), Price to Book Value ( PB Ratio ) and Dividend Yield ( DY Ratio ) of the Nifty Index  were at 17.68, 2.89 and 1.55 respectively as on 22nd August 2011.  ( More information and a long term analysis on Nifty historical valuation are available from the "Nifty Fundas" page ).

Monday, August 22, 2011

Update for 22nd August 2011


A Late Edition of Momentum Signal 

This late edition of Momentum Signal is limited to just the bare minimum due to some personal emergency. Please bear with the author for such a short weekly edition.

        Nifty Futures Daily Chart 


 Nifty Trailing Fundamentals  


The trailing Price Earnings Ratio  ( PE Ratio ), Price to Book Value ( PB Ratio ) and Dividend Yield ( DY Ratio ) of the Nifty Index  were at 17.49, 2.86 and 1.57 respectively as on 19th August 2011.  ( More information and a long term analysis on Nifty historical valuation are available from the "Nifty Fundas" page ).

Friday, August 19, 2011

Update for 19th August 2011


Another Gap Down !

This blog had repeated time and again that Nifty valuations were stretched, and now, it seems that market is in the process of clipping the same. As the market has been pricey for a very long stretch of time and most market participants became used to the higher valuations, the present correction may appear to be very deep. However, it remains to be said that the trailing valuations have just fallen to the long term averages now. It is a very simple matter that the long term averages are supposed to be somewhere in the middle of the valuation ranges and therefore, at least for half the period used to calculate the averages, the index valuation have remained below the long term averages. Therefore, there is no such near limit at which the fall may get arrested. But, it is a fact that market has become comparatively safer for long term investors for they can buy at somewhat reasonable prices from now on and this itself may provide a bit of margin of safety and long term upside.     

 Nifty Trailing Fundamentals  


The trailing Price Earnings Ratio  ( PE Ratio ), Price to Book Value ( PB Ratio ) and Dividend Yield ( DY Ratio ) of the Nifty Index  were at 17.85, 2.92 and ( 00 )* respectively as on 17th August 2011.  ( More information and a long term analysis on Nifty historical valuation are available from the "Nifty Fundas" page ). * Please note that the latest D/Y is not updated due to some technical problems with the source NSE website. 

                                                                                     Nifty Futures Daily Chart 


Thursday, August 18, 2011

Update for 18th August 2011


Bleeding Continues !

After the formation of an inside day candle yesterday, the down trend has started again. Market is in the process of testing the panic low, as indicated in the previous post. The immediate short term direction of the index may depend up on the said test.  

Nifty Futures Daily Chart 


Wednesday, August 17, 2011

Update for 17th August 2011


Blue Chips Hold, But Mid & Small Caps Slide Continues !

As is expected after a deep fall, the international stock indices bounced back, and now, it seems that the process of testing the resistances are over. The next leg, naturally is a test of the panic lows. Since the Indian stock markets were already in a long drawn down trend, the losses were of lesser magnitude over here. And hence the smaller bounce. The bounce failed at the previous low cum resistance at the 5175 - 5225 level and thereafter, the Nifty index is in the process of finding value by testing the lower support. The 4950 - 5000 area being the panic low extends short term support for the time being. If the support holds, Nifty may again test the resistance area. Barring any major triggers, Nifty index may spend some time trading between the 5000 - 5175 area before the next leg of any directional movement. Meanwhile, some of lesser quality stocks may continue to slide.  

Nifty Futures Daily Chart 


 Nifty Trailing Fundamentals  


Though, the major indices closed at a fourteen month low as on yesterday, the trailing valuation ratios of the Nifty index are just reaching the long term averages right now, as the trailing ratios were   hovering at significantly higher levels of recently indicating over valuation.
 

Tuesday, August 16, 2011

Update for 16th August 2011


The Slide Continues !


Due to certain personal matters of unavoidable nature, this post is late and consists of only the basic charts and system update.  

Nifty Futures Daily Chart 


S&P CNX Nifty Index - Weekly Chart


Friday, August 12, 2011

Update for 12th August 2011


An Inside Day Candle !

Yesterday's trading lead to the formation of an inside day candle in the daily charts. Astute traders may note that an inside day candle near the Bollinger Band, and that too after a significant move in any security may, sometimes, indicate a short term reversal. Please read this old post which dealt with the subject of inside candles for more information. However, as matter of abundant caution, it is also stated that these patterns are not foolproof and sometimes these fail too. In case of a reversal triggering, anywhere near the middle average becomes the first target. And in case of the reversal continuing further, the other Bollinger band becomes the next target. Above all, if the pattern fails after triggering a reversal trade, it may indicate the continuation of the previous trend. The daily chart of Nifty Futures given below shows a shaded area as an example of a recent reversal from the Bollinger Band after the formation of two inside day candles. (  Please click on the chart enlarge and examine the previous low. )   However, the short term resistances detailed in the previous post may still act against such a short term reversal, if triggered. 

Nifty Futures - Daily Chart 


Thursday, August 11, 2011

Update for 11th August 2011


The 5175 - 5225 Resistance Acting Tough ?

It seems that the lower boundary of the gap which almost coincides with the top end of the previous low cum support area of 5175 - 5225 is acting as a strong resistance as of now. Failure to clear the resistance will lead to a test of the lows in the ensuing days. 

Nifty Futures - Daily Chart 


Wednesday, August 10, 2011

Update for 10th August 2011


High Volatility to Continue !

It seems that the high volatility in the market may take some more time to subside. The following chart of India VIX shows the explosion of implied volatility seen in the Nifty Options.

India VIX - Daily Chart  


Nifty Futures - Daily Chart 


Tuesday, August 9, 2011

Update for 9th August 2011


Panic & Chaos Continue !

This edition of The Ultimate Momentum Signal post consists of just the basic minimum updates. Please see the previous post for more market commentaries.

Nifty Futures Daily Chart       


Monday, August 8, 2011

Update for 8th August 2011


It's Chaos Out There !


  • Finally, major stock market indices have decisively broken out of their eighteen month old upward moving trading channel. Sadly, they have broken downwards. 
  • The just broken channel had a height of 650 points approximately.
  • Now the question is, will the market revisit the lower boundary of another support line to be drawn some 650 points below the just broken channel.
  • As stock markets all over the world have been shaken and started a significant down move simultaneously, such a possibility is not out of the realms as of now.
  • As such, next major medium term support for the Nifty is at around the 4700 to 4800 levels. However, readers may please take note that this is not a trade recommendation and is provided as a medium term plausible scenario. Even if the scenario works out  as expected, it might happen only after some time and that too, after some recoveries. It is also possible that, by that time, the support might move upwards merely because of  passage of time.  
  • In the meanwhile, the lower boundary of the just broken old trading channel and the forward slanting supply line will act as the resistances against any up moves.
  • Even after the continuous fall for the past eight months or so Nifty index is just reaching the long term trailing valuation averages by now. This author was regularly pointing out the fact that the index is retaining premium valuations, in spite of the low growth scenario. ( Please see the regular updates of trailing fundamentals of Nifty index and the long term analysis report thereof. )        

S&P CNX Nifty Index - Weekly Chart 


Nifty Futures Daily Chart       


Friday, August 5, 2011

Update for 5th August 2011


The Tsunami is Here !


Yesterday, it felt like the market is in the process of testing the resistances around candle of two days back. But the test failed at the first gate, ie. at the low of the reference candle. What happened afterwards was beyond anybody's guess. Now, at the time of writing this post, Nifty Future is hanging on to the last known support of 5175 - 5200 area. As the financial markets have entered an era of extreme volatility, technical predictions would be of not much help. Yet, it seems that a break of the support at 5175 - 5200 may lead to a swing even to a low of 4800 levels. However,  it remains to be reiterated that markets never travel in straight lines and even if it reaches the predicted levels, it might be after much back and forth movements.  It is also notable that sharp falls are associated with sharp recoveries, as the increased level of volatility acts both the ways.

Nifty Futures Daily Chart       


Thursday, August 4, 2011

Update for 4th August 2011


A Test of Resistance is On ?

After the gap down open on yesterday, Nifty futures didn't suffer much damage.  Volumes at the lower end seemed to be low and it lead to a short term reversal. The market action also lead to the formation of an inverted hammer kind of candle in the daily charts. Though the technical position has not changed much, it seems that the market is in the process of testing the resistances above. The immediate outlook for the market depends on the outcome of this test. Day before yesterday's low, close, high etc can become the important reference points on this test. 

Nifty Futures Daily Chart   


Wednesday, August 3, 2011

Update for 3rd August 2011


The Drift has Started Again ?  

It seems that the drift has started again on the back of the triggers provided by the international markets. The immediate support for the market is in the area between 5350 - 5400. The next lower support is around the previous double bottom at around the 5175 - 5200 area. As the downtrend has been continuing for a long time by now, sudden steep falls are not expected and hence the author is forced to use the word drift in the title of this update. Market may drift for some more time and in the meanwhile may respond to short term triggers, both negative and positive. Therefore, trading light and part booking of profits, if any, seems to be best solution to overcome the drifting markets.

Nifty Futures Daily Chart 


Tuesday, August 2, 2011

Update for 2nd August 2011


Same Old Story Continues !  

I had indicated in the yesterday's post that failure to clear the 5550 -5560 level may see the Nifty futures testing the lows. It was also said that in the absence of any triggers, some back and forth trading may be expected. The kind of trading seen today morning also proves that this scenario is playing out so far. The reasons for this kind of trading are the following. ( a ) The medium term trend is still neutral to down due to the rising interest rates and inflation and the consequent slowing growth and profitability, ( b ) In spite of the aforesaid reasons warranting lower stock prices, the best of Indian stocks are still retaining somewhat premium valuations on the expectations of long term growth while most other stocks are still on a correction path, and ( c ) These diametrically opposite factors have lead to the sideways kind of trading and a breakout in either direction is beyond anybody's call right now.  

Nifty Futures Daily Chart 


Monday, August 1, 2011

Update for 1st August 2011


Back in the Old Trading Range ?  

As indicated in the previous post that a short reversal might be in the making, Nifty future is testing the 5550 level today morning. Failure to clear the 5550 - 5560 level may still lead to a test of the lows. However, closes between the 50 DMA ( 5525 ) and the 100 DMA ( 5590 ) will indicate continuation of the trading range. As the Nifty futures are placed between important trend lines and various Moving Averages, some kind of two way trading will continue in the absence of  any triggers. Therefore, all trend following systems, including the Momentum Signal will continue to whipsaw.

Nifty Futures - Moving Averages Chart


Nifty Futures Daily Chart 


Friday, July 29, 2011

Update for 29th July 2011


 The Test of 50 DMA ( 5525 ) is On !  

Yesterday's derivative expiry did not lead to any free fall and the expiry was managed in the vicinity of the 5500 strike. It seems that the lower open helped the market to retain the ability to test the gap at the open. However, today's market action of another lower open below the yesterday's range and a test of yesterday's high and 50 DMA  may be indicating a sort of short term reversal. If today's  rally leads to a close above the 50 DMA  or a better close above the 5550 level, then it may be construed that the market is still bound by the earlier tight trading range between the 50 DMA and the 200 DMA. Until the market breaks out clearly out of this trading range, most technical indicators designed to trade trends may continue to whipsaw. However, a failure to clear the 5550 level may lead to a test of lows and even the continuation of the correction.

   Nifty Futures - Daily Chart  


Thursday, July 28, 2011

Update for 28th July 2011


 The Battle for the 5500 Strike is On !  

The major option position build up at the 5500 strike is acting as a major battle point in today's trading, although some of the Put build up has moved to the 5400 strike. Some more Call selling was observed at the 5500 strike. Though the option writers would like an expiry at around the 5500 strike, it is still unclear whether this will be managed because of the external factors. The next support for the market below the earlier 5500 - 5520 support is around the 5350 - 5400 area. 

   Nifty Futures - Daily Chart   


Wednesday, July 27, 2011

Update for 27th July 2011


 Nifty Future Back to the 100 DMA !  

Following the higher than expected hike of interest rates by the RBI on Tuesday, Nifty future has already abandoned it's tentative move to test the higher resistances and returned to the more familiar level of 5880 where the 100 DMA is situated now. The important question now is whether the contract will test the lower support of 5500 and 50 DMA at 5520. As the 5500 strike is having huge Put option open interest, the level may act as a major reference point for today and tomorrow. Though unlikely, in case the 5500 level is broken before the expiry, it may lead to a mad scramble to secure the open positions by the put writers. They could cover / hedge their positions either by buying the open puts at a loss or by selling Nifty futures. As the time before expiry is short, some of them may hedge short puts by selling Nifty futures and this may lead to a sharp fall to the next strike at 5400. Apart from this, there is no change to the technical position of the market.  

   Nifty Futures - Daily Chart   


Tuesday, July 26, 2011

Finally, RBI takes Charge !


RBI has raised the repo rate by an unexpected 50 basis points today. This is the first time the central bank has taken a bold stand in the past one and a half years or so in which inflation has been galloping almost uncontrolled. It is sad to recall that the central bank has been treating the ever rising inflation with kid gloves and it even seemed that the Bank is not in control of the situation. But the tragedy is that the lethargy at the RBI has lead to a situation where the higher inflation has become entrenched in the economy and it may require even higher rates to remedy the situation. 

Even if it is rhetorical, some firm interest rate action at the start of the rising inflation curve would have been more effective than the initial eye in the sand mode in which it operated initially. The shock and awe of such an initial strong action would have created lesser hassles than the late in the cycle tightening which will lead to more damage to the long term economic growth.
    
Yeah, the latest RBI action once again forces one to recall the wisdom in the old saying !  Yeah, it says ' a stitch in time saves nine !'        

Some previous posts on the subject :

 Is this Monetary Policy on Non- Policy ?

 Does Inflation Affect the Nifty Valuations ?


 RBI Willing to Strike, But Afraid to Hurt Again !

© 2010-2011, momentumsignal.blogspot.com All rights reserved.

 Disclaimer: No research, information or content contained herein or in the accompanied spreadsheet shall be construed as advice and is offered for information and educational purposes only. We shall not be responsible and disclaim any liability for any loss, liability, damage (whether direct or consequential) or expense of any nature whatsoever which may be suffered by the user or any third party as a result of or which may be attributable, directly or indirectly, to the use of or reliance on any information or service provided. All files/information is provided 'as is' with no warranty or guarantee as to its reliability or accuracy. We do not recommend, promote, endorse or offer any guarantee whatsoever in respect of any services or products offered in the advertisements displayed on the site by Google AdSense.

Update for 26th July 2011


    Nifty Futures Near the Resistance   

Nifty futures closed just below the resistance band between 5700 and 5760 yesterday. It is almost impossible to guess whether a breakout will happen now or not because of the mostly tight range in which markets are trading now. Please read the previous post for more information on resistances and supports.

   Nifty Futures - Daily Chart 


Monday, July 25, 2011

Update for 25th July 2011


    Another Bounce, Now What ?      


  • The technical position of the whole market has not changed at all in the past week.
  • Nifty futures and Nifty index are steadfastly trading around the 100 DMA at around the 5890.
  • All attempts to break out from the narrow range have failed so far.
  • Lower supports for the market are at the 5500 - 5550 ( 50 DMA at 5515 ) and 5350 - 5400 levels. 
  • Similarly the resistance is at the last week's high at 5650-5660 and  5700 -5760 levels.
  • Even if the market breaks out  firmly above the last Friday's high, it will still face the resistance at the 5700 -5760 area from the forward slanting supply line as well as the 200 DMA.
  • If the market successfully breaks out above the 5700 -5760 area, then, a rally to 5900 to 5950 may be expected. 
  • As already stated in the previous posts, a firm break out above or below the major resistances or supports is becoming a requisite before for most technical signals could start working.      
  Nifty Futures - Daily Chart 


Nifty Futures - Daily Moving Averages Chart 


Friday, July 22, 2011

Update for 22nd July 2011


    More of Listless Trading ?       

As Nifty futures have been trading in a horizontal range around the 100 DMA at 5586 for the past one and a half weeks, we may expect listless trading to continue till some breakout happens. Most technical signals or indicators may whipsaw till then. This edition is limited to just minimum system updates for the aforesaid reason. 

  Nifty Futures - Daily Chart  

Thursday, July 21, 2011

Update for 21st July 2011


                                     Back to Square One !                                                                                                          

Nifty futures are back to square one as it has again come back to the last week's trading range around the 100 DMA. There is no change in the technical out look as such. Please read the previous posts for a detailed technical view. Readers may please note that the Momentum Signal system is susceptible to whipsaws in ranged markets and the fact is already disclosed in the risk factors page. It seems that some kind of a breakout in either direction is becoming a requisite before the technical signals starts working.


  Nifty Futures - Daily Chart   


Wednesday, July 20, 2011

Update for 20th July 2011

   A Bounce from the Support Area !

Yesterday, Nifty futures bounced from the upper end of the earlier indicated support area of 5500 - 5550. In fact, Nifty futures recorded nearly identical lows at around the 5560 mark on three trading days. Once the market finds that it is not breaking a support, it tends to move to the opposite direction and tries to test the next resistance. Last week's high at around the 5660 - 5670 remains as the short term resistance. If this level is taken out, then the resistance from the 200 DMA and downward moving upper resistance line at the 5700 - 5750 level may come in to play. Barring a breakout above the latter resistance, Nifty may spend some more time trading directionless in the broad trading range of 5500 to 5700 in the immediate future.

Nifty Futures - Daily Chart  


Tuesday, July 19, 2011

Update for 19th July 2011


  Nifty Futures are Still In No-Man's Land ?

There has been no change in the technical position of the market since the previous post. Hence, this post is limited to the charts and system updates.

Nifty Futures - Daily Chart  


Nifty Options Scene   

The July series Nifty Options Put Call ratio ( PCR July series ) closed unchanged at a 1.12 times as on Monday. 

Sunday, July 17, 2011

Update for 18th July 2011

    Nifty Futures In No-Man's Land ? 

It seems that Nifty futures is stuck in the no-mans land at present. Though the trading was highly volatile, Nifty futures closed without much change for the last four trading days. Moreover, in spite of the Momentum Signal going in to the negative territory, Nifty futures has remained steadfastly above the support of 5500  - 5550 area. 

Nifty Futures - Daily Chart   
   
Nifty Futures - Daily Moving Averages Chart

Friday, July 15, 2011

Update for 15th July 2011

   Nifty Futures' Direction - Still Undecided ?

The gaps in the charts of indices were filled as on yesterday. But, the direction of Nifty seems to be still undecided and it is still enjoying support at the 5500 - 5550 levels. Due to other pre-occupations, this edition is kept short with just the system updates.

Nifty Futures - Daily Chart       


Nifty Options Scene   

The July series Nifty Options Put Call ratio ( PCR July series ) closed higher at a  1.18 times on Thursday.


Thursday, July 14, 2011

Update for 14th July 2011

  Nifty Futures Still Supported by the 50 DMA ?

The gap seen in the daily chart of Nifty future was filled yesterday. But the gaps in the daily charts of the Nifty and Sensex  are still open and this makes the technical position tricky. Except for these comments today's update is limited to just charts and system updates. 

Nifty Futures - Daily Chart    


Wednesday, July 13, 2011

Update for 13th July 2011

 Nifty Futures Supported by the 50 DMA ?

Nifty futures reversed from the 200 DMA at 5750 level and traded lower to reach the 50 DMA at 5505. The 100 DMA is presently placed at 5575. Most of the trading yesterday was confined between these 50 and 100 DMAs. The presence of a wide gap between the trading ranges of the last two days also complicates the technical position. Such a gap may attract the market to fill it in the short term. Now, if the gap does not get filled in the next few days, the downtrend may continue with a minimum target of 5450. A break of  the 5500 level and 50 DMA may also lead to a revisit of the 5350 - 5400 support levels. However, all these are contingent upon the markets failing to cross the 100 DMA, filling the gap and closing above these important points.

Nifty Futures - Moving Averages Chart  


Nifty Futures - Daily Chart     


Tuesday, July 12, 2011

Update for 12th July 2011

The Reversal Leading to a Correction ?

As on yesterday's close, the Ultimate Momentum Signal closed in the neutral territory. The last buy signal was given by the system on 27th June, 2011 at a Nifty future level of 5537. This buy signal lead to maximum favorable excursion ( MFE ) or maximum profit opportunity of 223 Nifty points. 

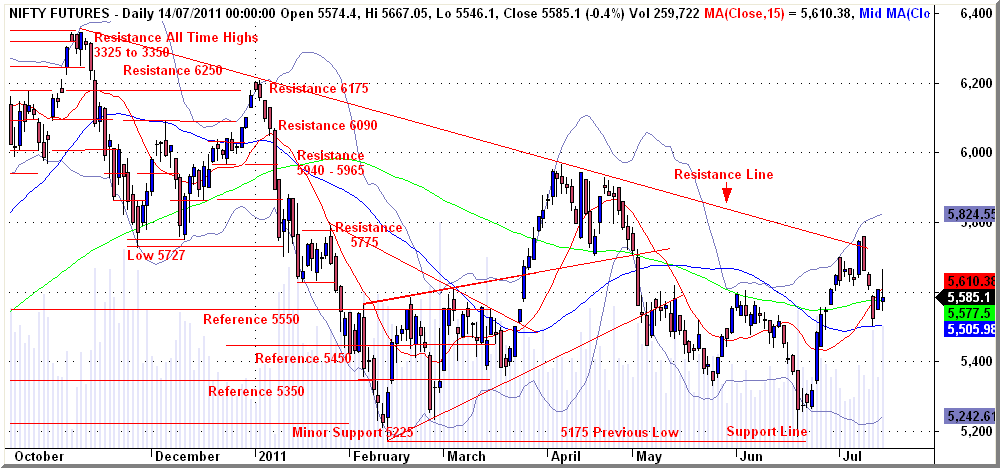
Meanwhile, as envisaged in all the three previous posts, Nifty future has returned to the lower support area of 5500 to 5550 level as a consequence of it's failure to break above the 5750 - 5760 resistance. Now the important question is whether the correction would continue or not. Irrespective of the outcome, the Momentum Signal seems to be poised to give a sell signal as on today's close unless the market makes a strong recovery intraday. In case the correction continues after some trials to fill the gap between yesterday's and  today's trading ranges, the next support would be at the 5350 - 5400 levels where the lower boundary of the old trading channel is situated at present.

Nifty Futures - Daily Chart