Two Days of Indecisive Trading and What Now !
As part of the scenario analysis given in the last Friday's post, it was stated that if the Nifty future was unable to cross the previous day's high, it may try to revisit the 5860 support or even lower levels. However, this scenario was expected only in the absence of positive international cues. In spite of the western markets continuing their uptrend, Nifty futures opened flat on last Friday and enacted a part of the scenario by trading below the previous day's low. However, the positive international cues prevented the Nifty future and the index heavy weights from losing much on Friday. The advance decline ratio showed a very negative picture on Friday because of wide spread losses in many stocks. The market also lacked volumes on Thursday and Friday, may be because of the lack of enthusiasm ( ? ) to trade at the present levels.
Nifty Futures - Intra-day Chart

The intra-day chart above shows the lackluster trading seen on last Friday. The upper horizontal line show the 6030 resistance area and the lower, the low of last Thursday.
Nifty Futures - Daily Chart

The daily chart also shows the two days of lackluster trading in the form of two doji candles which might indicate even a reversal of the market to lower levels. However, the international cues at present are still positive and therefore, these doji candles may be indicating just a pause. As the market could not trade in marrow ranges with low volumes for many days, it is imperative that it moves from this level in the next one or two trading days. Except for the higher probability of the market moving out of this tight range, the technical position of the market hasn't changed. Therefore, the resistances and supports indicated in the previous posts remain valid for Monday's trading too.
Nifty Index - Weekly Chart
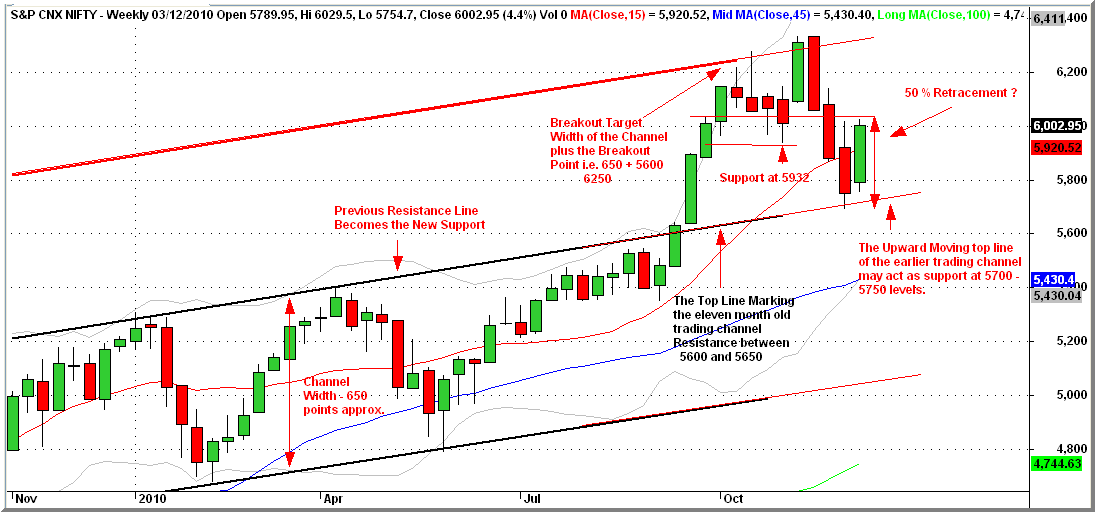
The weekly chart shows the exact reason for the sluggishness of the markets in the last two days. It is seen that the index is having it's sluggishness at the 50 % reatracement of it's recent fall from the highs.
Nifty Option Scene
The December series Nifty options Put Call Ratio ( PCR ) remained at 1.30 on Friday. Significant additions to the Put open interest were seen again at the 5900 and 6000 strikes on Friday. However, additions to Call open interest were seen comparatively less than the Put open interest. The Call open interest additions were at the 6000 and 6100 strikes.
Nifty Trailing Fundamentals

The trailing Price Earnings Ratio ( PE Ratio ), Price to Book Value ( PB Ratio ) and Dividend Yield ( DY Ratio ) of the Nifty Index were at 23.89, 3.77 and 1.04 as on 3rd December 2010. Readers may please note that the periods in which the trailing PE Ratio of the Nifty index persistently stayed above the 25 mark were limited to just two occasions in the years 2000 and 2007-08. And both these periods coincided with the highs or bubble periods just before the burst of the then bull markets. ( More information and analysis on Nifty historical valuation is available from the "Nifty Fundas" page of this blog ).
Latest Ultimate Momentum Signal
The updated Momentum Signal spreadsheet showing the latest signal values of the current month Nifty future and the Nifty index is given below :

The Momentum Signal values for Nifty futures and the two indices closed at +100 as on Friday.
Projected Momentum Signal Close Values
The projected levels Momentum Signal values applicable to various ranges of closing values of the current month Nifty Futures, Nifty Index and the BSE Sensex, as at the close of next trading day, ie. as on 6th December, 2010, are given in the following table. All readers are requested to take note that the table below is just a ready reckoner for the next day's Momentum Signal values and are in no way any targets for the Nifty futures or indices shown therein.

Please click on the table to enlarge. For more info on the above table, please click here.
All readers are requested to read the Risk Factors, Risk Analysis, Position Limits and FAQs pages of this blog to have a reasonable understanding of the system. Please do post your suggestions and comments on how this blog can be made more useful.
Cheers and Prosperous Investing and Trading !!!
To access and/or download the free online Position Limit Calculator click here.
To checkout the five year history of The Momentum Signal Spreadsheet click here
© 2010, momentumsignal.blogspot.com All rights reserved.
Disclaimer: No research, information or content contained herein or in the accompanied spreadsheet shall be construed as advice and is offered for information and educational purposes only. We shall not be responsible and disclaim any liability for any loss, liability, damage (whether direct or consequential) or expense of any nature whatsoever which may be suffered by the user or any third party as a result of or which may be attributable, directly or indirectly, to the use of or reliance on any information or service provided. All files/information is provided 'as is' with no warranty or guarantee as to its reliability or accuracy. We do not recommend, promote, endorse or offer any guarantee whatsoever in respect of any services or products offered in the advertisements displayed on the site by google adsense.
No comments:
Post a Comment