Nifty Futures Close Below the 100 Day MA !
The last post was titled "Nifty Heavy Weight Stocks Also Turn Losers !", but this author couldn't have anticipated the kind of losses suffered by the market on Thursday. Even though the previous posts could report about the lack of volume, all round negative market internals and a deteriorating Put Call Ratio ( PCR ), the losses were beyond expectations. It seems that the excesses of the recent bull market and especially the operators and FII led the vertical rally from the 5550 level to the previous high of 6300 plus levels, is being set right by the market now. Now, on observing the all round losses suffered by many traders and investors, this author is forced to reproduce some quotes from the post dated 9th September, 2010, which talked about the then bull fury and it's possible excesses and after effects.
Excerpts from the post dated 9th September, 2010
"Any breakout above the trend channel may be associated with a mad scramble to get in to stocks by the retail crowd. The tipsters and talking heads will have their time in the lime light. Analysts will start finding new reasons for buying stocks at high prices. Euphoria will prevail. And no resistances will stand in the way of the mad bulls. All the dud stocks may become the favorites of the masses once again. And when the bubble bursts, another set of traders and investors will learn their stock market lessons. ( To read another short description of this scenario, click here to read the post dated 23rd August, 2010. )
To those readers who might be wondering why this blogger is hell bent against another super duper rally in the stock markets, let it be made clear that this blogger is not hell bent against any rally or otherwise. It is only because this blogger likes an orderly stock market which leaves some scope for appreciation for the buyers in the long term. If the market overshoots on the upside, it will lead to all kinds of non sustainable investments and this in turn will lead to bad markets tomorrow. Higher stock prices makes dubious companies raise capital for questionable projects which will fail at the first signs of economic hurdles. In the end, an overpriced market is as bad or far worse for the economy than an under priced market. In fact bubbles leads to wealth destruction than the claimed wealth creation."
Nifty Futures - Intra-day Chart

Thursday's trading could be divided in to three distinct phases. In the first phase, Nifty future opened flat and the trading remained between the reference levels of 5900 and 5940. Once the 5900 level was broken, trading went in to the lower range between the 5860 and 5900 reference levels. And once the 5860 level was also taken out, all panic broke out and the contract easily broke through the 5830 100 DMA support to reach almost the next indicated support at 5750. The day's low was 5757. Nifty futures recovered at the end of the session to close at 5792.
Nifty Futures - Daily Chart
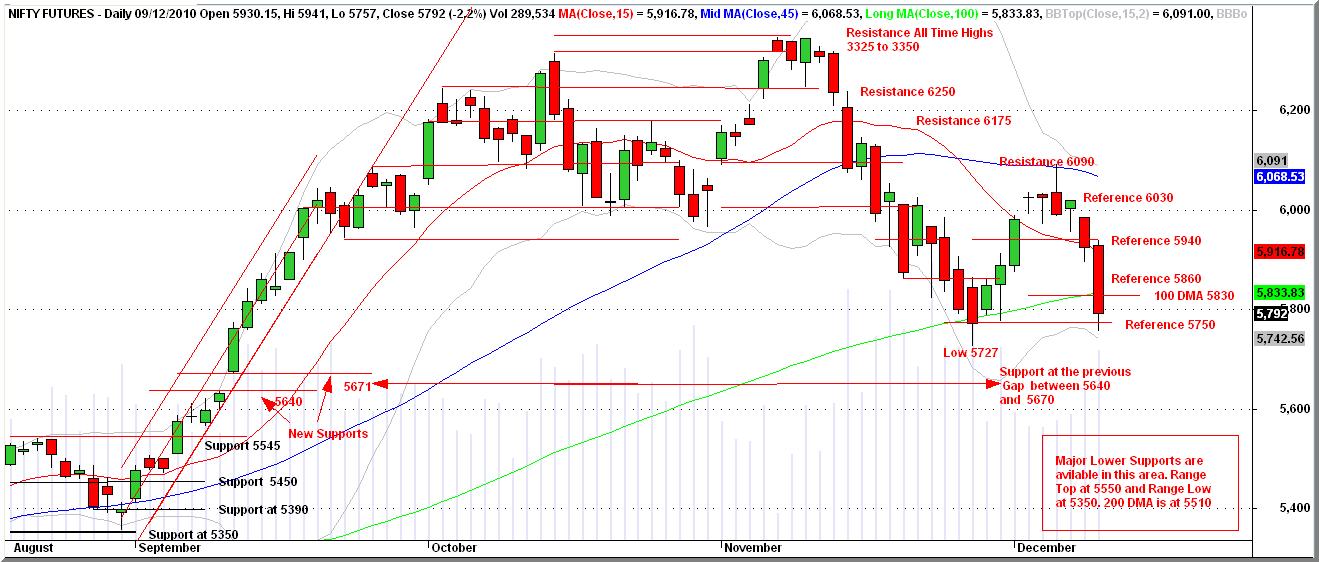
Nifty future has closed below the 100 day simple moving average ( 100 DMA ) at 5830. The contract has some support between 5725 and 5750 being the previous low and from the top line of the previous trading channel. The immediate lower supports are at 5650 levels. The next level of major supports are in the band between 5350 to 5550 levels being the previous trading range before the breakout from the then trading channel. The 200 DMA of Nifty future is present at 5510 levels. Since the present fall is directly related to the special situations prevailing here, no clear analysis of the market is possible at present. If the international markets too join the downtrend, market may undergo another leg of heavy losses. The important reference points for the Friday's trading are 5650, 5750, 5830, 5860 and 5900.
Nifty Option Scene
The December series Nifty option PCR deteriorated further to 1.01 on Thursday. Widespread and heavy call writing was seen from the strikes from 5700 to 6000 levels. The strikes at 5800 and 5900 saw increase in call OI to the tune of 22 lakhs ( 2.2 million ) each. The increase at 5700 and 6000 strikes were 6 and 14 lakhs respectively. Some minor additions to Put OI were also seen at the 5500, 5600 and 5700 strikes whereas the Put OI declined at 5800, 5900, 6000 and 6100 strikes. The deterioration in the PCR might be indcating further losses in the market.
Nifty Trailing Fundamentals

Latest Ultimate Momentum Signal
The updated Momentum Signal spreadsheet showing the latest signal values of the current month Nifty future and the Nifty index is given below :

Projected Momentum Signal Close Values
The projected levels Momentum Signal values applicable to various ranges of closing values of the current month Nifty Futures, Nifty Index and the BSE Sensex, as at the close of next trading day, ie. as on 10th December, 2010, are given in the following table. All readers are requested to take note that the table below is just a ready reckoner for the next day's Momentum Signal values and are in no way any targets for the Nifty futures or indices shown therein.

Please click on the table to enlarge. For more info on the above table, please click here.
Readers are requested to go through the Risk Factors, Risk Analysis, Position Limits and FAQs pages of this blog to gain a reasonable understanding of the trading system. Please do post your suggestions and comments on how this blog can be made more useful.
Cheers and Prosperous Investing and Trading !!!
To access and/or download the free online Position Limit Calculator click here.
To checkout the five year history of The Momentum Signal Spreadsheet click here
© 2010, momentumsignal.blogspot.com All rights reserved.
Disclaimer: No research, information or content contained herein or in the accompanied spreadsheet shall be construed as advice and is offered for information and educational purposes only. We shall not be responsible and disclaim any liability for any loss, liability, damage (whether direct or consequential) or expense of any nature whatsoever which may be suffered by the user or any third party as a result of or which may be attributable, directly or indirectly, to the use of or reliance on any information or service provided. All files/information is provided 'as is' with no warranty or guarantee as to its reliability or accuracy. We do not recommend, promote, endorse or offer any guarantee whatsoever in respect of any services or products offered in the advertisements displayed on the site by google adsense.
1 comment:
I really appreciate your blog and your time and effort and i can say that your blog is useful and valuable. i got some good from your blog and i want to thank to you for sharing.
nifty option tips
Post a Comment