A Day of Losses and What to Expect Now ???
Even though it was mentioned in the last post that the chance of a breakout above or below the inside day candle remains more or less equal, it was specifically said that (a) the subtle gap might act as a precursor to some weakness ahead, (b) inside day candles can be traded by entering trades at the break of both the high and the low of the candles, (c) traders may exercise caution about a break below the low of the inside day candle, as it may trap those who were expecting a breakout above 5350 level and (d) long positions need be protected by an intraday system stop at 6216. ( High 6349 minus 2.1 % of 6349 = 6216 ).
Now, let's check out what happened in Thursday's trade. Nifty futures opened flat on Thursday and the initial range was of just 20 points. The high of the day was at 6321 and the initial low was at 6300. Trading remained directionless till around 12.00 noon. However, unable to make any progress upwards, the futures broke through the low of the inside day candle to record lows between 6275 and 6280. All recoveries from these lows were unable to progress beyond 6298 level, just three points inside the previous day's candle. The failure to progress upwards attracted further selling and later on selling accelerated. Nifty futures even broke through the intraday protective stop placed at 6216. ( High 6349 minus 2.1 % of 6349 = 6216 ). The day's low was at 6209. Nifty futures recovered later on to close at 6237.
The long position entered in accordance with the Momentum Signal system at the 6150 levels has been exited by the system stop as on 11th November, 2011 with an approximate profit of 65 points. Traders may note that the last buy signal has resulted in a maximum favorable excursion of around 200 points in the Nifty futures and the resistance at 6350 levels was a known thing for the entire past month for all those who were following this blog. ( Or simply, it would have been possible to exit with a profit of at least 190 points !! ).
Nifty Futures - Daily Chart

Nifty future has closed inside the support area between 6230 to 6250. In case the support holds in Friday's trading, Nifty future may try to climb back. However, 6275 to 6300 area may act as a minor resistance now. The lower supports are at 6175 and 6085 levels. ( Please click on the chart above for details ). Thursday's fall has effectively closed a seven point gap between the trading days of 3rd and 4th November. As the US market was also trading with losses at the time of writing this post, Nifty futures may initially trade in the lower half of Thursday's range on Friday.


The above table shows the latest data related to Nifty trailing valuation, sourced from the NSE, India website. The historical trailing price earning ( PE Ratio ), price to book value ( PB Ratio ) and dividend yield ( DY Ratio ) of the Nifty Index were at 25.11, 3.89 and 1.01 as on 11th November 2010. Readers may please note that the periods in which the Nifty index traded above a historical PE Ratio of 25 were limited to just two occasions in the years 2000 and 2007-08. And both such periods coincided with the highs just before the burst of the then bull markets. ( More information and analysis on Nifty historical valuation is available from the "Nifty Fundas" page of this blog ).Nifty Index - Weekly Chart

Even though the last week's close of the Nifty index was tentatively above the target cum resistance line drawn on the basis of the earlier breakout from the year long trading channel, it has already corrected and returned to the new trading channel. Since the latest close is in the neutral area, it better to wait till the market itself reveals the next trading direction.
Nifty Fundas
The trailing PE multiple of the Nifty index has been quoting above the 25 mark for some time. The 25 PE mark can almost be termed as the starting point of the bubble territory.

Updated Momentum Signal Spreadsheet
he updated spreadsheet showing the Momentum Signal as at the close of the trading on 11th November, 2010 is given below :

Nifty future and the underlying index have returned to the neutral area in accordance with the Momentum Signal system as on the close of Thursday. However, the BSE Sensex has closed still with with a positive Momentum Signal value of +60. ( Not seen in the spreadsheet above ).
Projected Momentum Signal Close Values
The projected levels Momentum Signal values applicable to various ranges of closing values of the current month Nifty Futures, Nifty Index and the BSE Sensex, as at the close of next trading day, ie. as on 12th November, 2010, are given in the following table. All readers are requested to take note that the table below is just a ready reckoner for the next day's Momentum Signal values and are in no way any targets for the Nifty futures or indices shown therein.
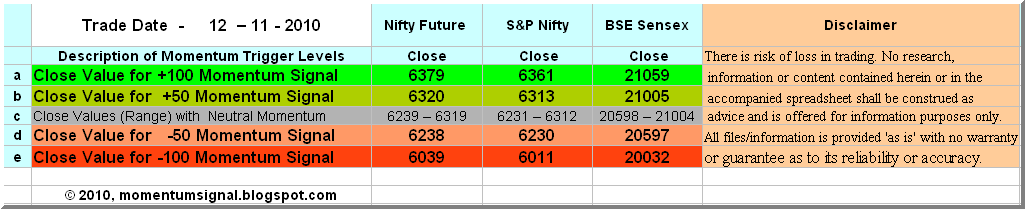
Please click on the table to enlarge. For more info on the above table, please click here.
As seen in the table above, a lower close on Friday may force the system to indicate a sell signal with a value of -50 value. However, traders may note that a sell signal with -50 momentum signal value in a bull market has a higher tendency of becoming a whipsaw.
Cheers and Prosperous Investing and Trading !!!
To access and/or download the free online Position Limit Calculator click here.
To checkout the five year history of The Momentum Signal Spreadsheet click here
© 2010, momentumsignal.blogspot.com All rights reserved.
Disclaimer: No research, information or content contained herein or in the accompanied spreadsheet shall be construed as advice and is offered for information and educational purposes only. We shall not be responsible and disclaim any liability for any loss, liability, damage (whether direct or consequential) or expense of any nature whatsoever which may be suffered by the user or any third party as a result of or which may be attributable, directly or indirectly, to the use of or reliance on any information or service provided. All files/information is provided 'as is' with no warranty or guarantee as to its reliability or accuracy. We do not recommend, promote, endorse or offer any guarantee whatsoever in respect of any services or products offered in the advertisements displayed on the site by google adsense.
No comments:
Post a Comment