The Support at 6000 Broken or Not ???
After a day of almost random and wild movements in the Nifty futures, one wonders what really happened during the day and why ? Yours truly is at a loss to explain the dramatic kind of movements seen in the Nifty futures on Wednesday. If we are not sure about what exactly happened during the day, lets observe it somewhat objectively and see what comes out of it !
Nifty futures opened at 6018, slightly lower than the previous day's last traded price of 6025. It immediately recorded the day's then low of 6010, which was slightly higher than the Monday's low of 6008. From thereon, the recovery rally started and Nifty futures recorded a high of 6068 in the morning session itself. Most of the trading till the 2.00 PM mark was confined to a narrow range of 30 points between 6030 and 6060. The trading remained very choppy and directionless. Just after the 2.00 PM mark, a sudden rally in the markets saw the futures recording a new daily high of 6077. ( This high incidentally remains just below the 6083 resistance mark indicated in the previous post. ) This new high actually took out the stops placed above the morning's high. What happened afterward is even strange. Nifty futures took out the stops at the then day's low and the 6000 levels too in a swift movement in the last half an hour of trading. It recorded a new daily low of 5987 but recovered immediately to close at 6015. Now the pertinent question is whether the support at the 6000 level still holds. The answer seems to be an 'yes'.
Nifty Futures - Daily Chart

The above chart shows that after a correction lasting almost five trading days, which includes the day on which the high was recorded, a doji candle seen in the chart. The kind of trading was also random and directionless making the doji candle more meaningful. A doji candle ( a candle in which the open and close are very near ) indicates indecision by the markets. A doji candle after a big move may indicate a pause or even a change of direction. As such the market may move in either direction from hereon but the chances of a recovery seemed to be higher. However, traders may not rule out the fact that market may retrace the correction once again after a recovery lasting a few trading sessions.
The open interest in the three near month contracts of Nifty futures increased by 8.83 lakhs on Wednesday. Significant addition of open interest in the Nifty call options were also seen at the three strikes at 6000, 6100 and 6200 levels. However, open interest in the Nifty puts were seen decreasing except at the 5800 strike. All the above data actually adds up only to increase the confusion in the analysis to find the immediate market direction. As the US markets are seen rallying overnight, Nifty future may recover and try to test the 6083 resistance on Thursday.
All Time Highs

Many readers who might not have access to the historical charts might be interested in knowing the all time highs of the Indian stock market indices. The above table shows the all time highs of Nifty futures (then current month ), S&P Nifty and BSE Sensex and the dates on which the highs were recorded. The all time intraday high of Nifty future is 6336 and that of the Nifty index is 6357. The highest closing prices of futures and the index were at 6288 and 6289 respectively.
Nifty Fundas
Together with the strong rally and non stop gains in the broader markets seen till recently, the trailing valuations levels of the Nifty index were hovering above the 25 mark till just two days ago. The 25 PE mark can almost be termed as the starting point of the bubble territory.

The above table shows the latest data related to Nifty trailing valuation, sourced from the NSE, India website. The historical trailing price earning ( PE Ratio ), price to book value ( PB Ratio ) and dividend yield ( DY Ratio ) of the Nifty Index were at 24.69, 3.76 and 1.05 as on 20th October 2010. Readers may please note that the periods in which the Nifty index traded above a historical PE Ratio of 25 were limited to just two occasions in the years 2000 and 2007-08. And both such periods coincided with the highs just before the burst of the then bull markets. ( More information and analysis on Nifty historical valuation is available from the "Nifty Fundas" page of this blog ).
This information is being provided for the benefit of long term investors only. For traders, they can enjoy the rally till it lasts. It may be noted that markets can remain overvalued and overbought for significant periods which can be much beyond our expectations.
Updated Momentum Signal Spreadsheet
The updated spreadsheet showing the Momentum Signal as at the close of the trading on 20th October, 2010 is given below :

The Momentum Signal value for Wednesday's close remained at the -100 levels.
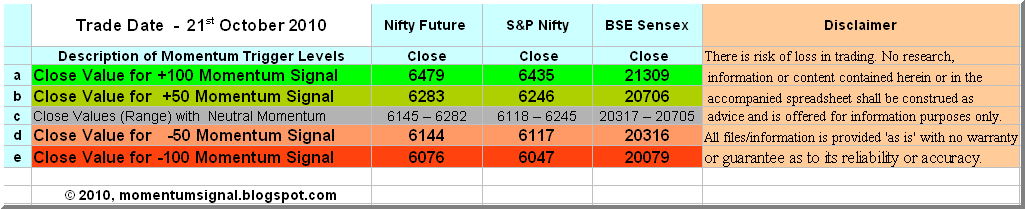
Projected Momentum Signal Close Values
The projected levels Momentum Signal values applicable to various ranges of closing values of the current month Nifty Futures, Nifty Index and the BSE Sensex, as at the close of next trading day, ie. as on 21th October, 2010, are given in the following table.
All readers are requested to read the Risk Factors, Risk Analysis, Position Limits and FAQs pages of this blog to have a reasonable understanding of the system. Please do post your suggestions and comments on how this blog can be made more useful.
Cheers and Prosperous Investing and Trading !!!
To access and/or download the free online Position Limit Calculator click here.
To checkout the five year history of The Momentum Signal Spreadsheet click here
Cheers and Prosperous Investing and Trading !!!
To access and/or download the free online Position Limit Calculator click here.
To checkout the five year history of The Momentum Signal Spreadsheet click here
© 2010, momentumsignal.blogspot.com All rights reserved.
Disclaimer: No research, information or content contained herein or in the accompanied spreadsheet shall be construed as advice and is offered for information and educational purposes only. We shall not be responsible and disclaim any liability for any loss, liability, damage (whether direct or consequential) or expense of any nature whatsoever which may be suffered by the user or any third party as a result of or which may be attributable, directly or indirectly, to the use of or reliance on any information or service provided. All files/information is provided 'as is' with no warranty or guarantee as to its reliability or accuracy.
No comments:
Post a Comment