google.com, pub-7808368332557457, DIRECT, f08c47fec0942fa0 The Ultimate Momentum Signal: 10/01/2010 - 11/01/2010

Sunday, October 31, 2010

Update on The Ultimate Momentum Signal - 1st Nov. 2010

     Indices Rebound from Support !!! 

When the trading ended on last Thursday, the derivative expiry day, November series Nifty futures were quoting at 6076 with a life time high premium of 88 points over the previous month's futures. Therefore, the market was generally expected to open higher on last Friday. It was quite difficult for the chartists to align the current month futures and the previous months futures on charts because of the excessive premium. The excessive premium of Nifty futures were seen declining to more reasonable 30 to 40 points during the day.   The Nifty futures opened at 6050 on Friday and selling pressure was seen almost right away. Even though the future contract  recorded a low below the crucial 6000 level in the morning session, it recovered immediately and started trading between mostly the 6000 and 6042 levels. A sell off after the 1.00 PM mark saw the futures recording a low 5966.25. However, another  recovery which started at 2.45 mark saw the Nifty futures recording the day's high at 6066. As is common these day's, it seems that the stops of  the bulls below the 6000 mark and bears above 6050 were taken out during Friday's trading. The last trade was at 6040. Even though the gains on a short position were not held, the sell signal indicated by the Momentum Signal as on the close of Thursday's trading would have resulted a favourable excursion of 110 points during Friday's trading.

Nifty Futures - Daily Chart 


Nifty future is still trading inside the broad trading range between 5940 and 6240. The futures and the underlying index are still supported at 5940 and 5930 levels respectively. The reason for the index reaching the support and the futures reversing from a higher level may be ascribed to the premium at which the derivative is priced at present. The following chart of the underlying index shows the intermediate term support at 5930. The last candles in both the charts are showing a tails at the bottom indicating support at lower levels. It may even indicate a reversal from the support level. As the Nifty future is still trading inside the broad trading range  and it is still near crucial support levels, the immediate market direction remains unclear.

 Nifty Index - Daily Chart


Nifty Fundas
 
The trailing PE multiple of the Nifty index has been quoting above the 25 mark for some time. The 25 PE mark  can almost  be termed as the starting point of the bubble territory.  Even though the multiple quoted just below the 25 mark on some days recently, Friday's  PE multiple has been  quoting at  25.03 times.


The above table shows the latest data related  to Nifty trailing valuation, sourced from the NSE, India website.  The historical  trailing price earning ( PE Ratio ), price to book value ( PB Ratio ) and dividend yield ( DY Ratio ) of the Nifty Index  were at 25.03,  3.82 and 1.03 as on 29th October 2010. Readers may please note that the periods in which the Nifty index traded above a historical PE Ratio of 25 were limited to just  two occasions in the years 2000 and 2007-08. And both such periods coincided with the highs just before the burst of the then bull markets. ( More information and analysis on Nifty historical valuation is available from the "Nifty Fundas" page of this blog ).


Updated Momentum Signal Spreadsheet

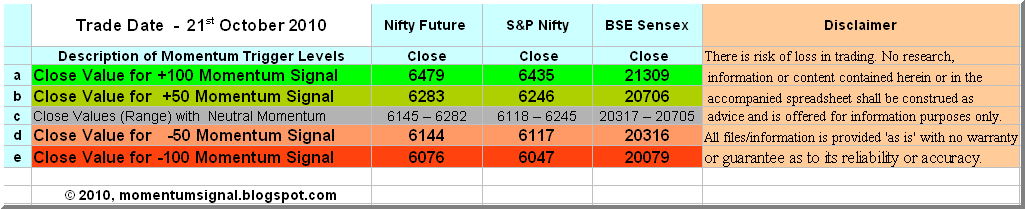
The updated spreadsheet showing the Momentum Signal as at the close of the trading on  29th October, 2010 is given below :
 
 
The Momentum Signal has given -100 values indicating negative momentum as on last Friday. 
 
Projected Momentum Signal Close Values


The projected levels Momentum Signal values applicable to various ranges of closing values of the current month Nifty Futures, Nifty Index and the BSE Sensex,  as at the close of next trading day, ie. as on  1st November, 2010, are given in the following table. All readers are requested to take note that the table below is just a ready reckoner for the next day's Momentum Signal values and are in no way any targets for the Nifty futures or indices shown therein.


  Please click on the table to enlarge. For more info on the above table,  please click here.

All readers are requested to read the Risk Factors, Risk Analysis, Position Limits and FAQs pages of this blog to have a reasonable understanding of the system. Please do post your suggestions and comments on how this blog can be made more useful.
 
Cheers and Prosperous Investing and Trading !!!

To access and/or download  the free online Position Limit Calculator click here.

To checkout the five year history of The Momentum Signal Spreadsheet click here

© 2010, momentumsignal.blogspot.com All rights reserved.

Disclaimer: No research, information or content contained herein or in the accompanied spreadsheet shall be construed as advice and is offered for information and educational purposes only. We shall not be responsible and disclaim any liability for any loss, liability, damage (whether direct or consequential) or expense of any nature whatsoever which may be suffered by the user or any third party as a result of or which may be attributable, directly or indirectly, to the use of or reliance on any information or service provided. All files/information is provided 'as is' with no warranty or guarantee as to its reliability or accuracy.

Friday, October 29, 2010

Update on The Ultimate Momentum Signal - 29th Oct. 2010

    Derivative Expiry Over and Out !!!

The Americans call the derivative expiry days like ours as a 'triple witching day'. My readers might be curious why this name is brought up now. It's simple. At least for today, this author has received a free license to use this alternative expression,  'triple witching day', without the necessary explanation. Anyone who has seen the market movements of Thursday afternoon doesn't require any explanation for this nomenclature. Nor does he can forget the new American expression for a derivative expiry day.

Now let's do a bit of scenario analysis  which could happen to anyone at any time. It's a dark night. There are no street lights. You are driving your car on a country road full of turns and even potholes. Suddenly your car's headlights are off. What would you do. "Hey, it is a nonbrainer. !! "  I would automatically brake and stop the car and think about it only after wards. " Now the question is: "Hey Hey Hey, why at all this simple bed time story is here ?". " Hey, We are all traders and we don't want stories " " ... and we are only  looking for trades."   But the answer is " Hey, Thursday's market was exactly like the situation in which you were driving and and your head llights just went off. "   " Yeah, Got it, but what is the moral of the story ? " " Not much, just stay away from trading when you are doubtful about the scenario." 

Now a bit of 'I told you so'... quoted from the last post. "   As the Nifty future is still trading inside a trading range, any kind of prediction is susceptible to become wide off the mark. Traders may expect choppy and volatile trading on Thursday. 

Last Thursday is the derivative expiry day in the Indian stock markets. Many strange price movements at the stock and market levels have been seen on the derivative expiry days, albeit occasionally.  The expiry of September month Nifty futures were at the 6030 levels. One day before the derivative expiry, the October month Nifty future contract has closed at the exactly same level. Therefore, what actually happens on this expiry day seems to be beyond anybody's guess at present. However, it seems appropriate to express another risk factor that any trading signal  indicated by the Momentum Signal system could become more error prone around the derivative expiry days and especially when the Nifty futures are trading in a range. " 

 
Nifty Futures - Daily Chart  


Nifty futures opened flat on Thursday. It recorded a high of 6049 and tested the previous day's low right in the morning. Later it started to recover but the trading was mostly confined between 6010 and 6040 in the morning session. Later in the afternoon, the futures broke above the morning session's high and rallied up to 6084. This high incidentally coincides with the previous support/resistance line of 6083. The correction from this high saw the futures tumbling like a house of cards. Just after the 3.00 PM mark when the clock for  finding out the weighted average price for the derivative settlement starts, the Nifty futures lost more than 50 points in less than  two minutes flat. The October month futures recorded a low of 5976 and the settlement was at 5988. The strangest factor seen on Thursday was the heavy premium of 88 points at which the November futures were seen quoting at over the October series.  This seems to be highest premium ever seen in respect of Nifty futures. The Momentum Signal system has again indicated a sell signal as on Thursday.  However, this sell signal is subject to the earlier indicated additional risk factor which is reproduced here. ".... it seems appropriate to express another risk factor that any trading signal  indicated by the Momentum Signal system could become more error prone around the derivative expiry days and especially when the Nifty futures are trading in a range. "     

Nifty Fundas
 
The trailing PE multiple of the Nifty index has been quoting above the 25 mark for some time. The 25 PE mark  can almost  be termed as the starting point of the bubble territory. Thursday's  PE multiple has been  quoting at  24.59.


The above table shows the latest data related  to Nifty trailing valuation, sourced from the NSE, India website.  The historical  trailing price earning ( PE Ratio ), price to book value ( PB Ratio ) and dividend yield ( DY Ratio ) of the Nifty Index  were at 24.59 3.76 and 1.04 as on 28th October 2010. Readers may please note that the periods in which the Nifty index traded above a historical PE Ratio of 25 were limited to just  two occasions in the years 2000 and 2007-08. And both such periods coincided with the highs just before the burst of the then bull markets. ( More information and analysis on Nifty historical valuation is available from the "Nifty Fundas" page of this blog ).


Updated Momentum Signal Spreadsheet

The updated spreadsheet showing the Momentum Signal as at the close of the trading on  28th October, 2010 is given below :
 
 
The Momentum Signal has indicated a sell as on Thursday.
Projected Momentum Signal Close Values


The projected levels Momentum Signal values applicable to various ranges of closing values of the current month Nifty Futures, Nifty Index and the BSE Sensex,  as at the close of next trading day, ie. as on  29th October, 2010, are given in the following table. All readers are requested to take note that the table below is just a ready reckoner for the next day's Momentum Signal values and are in no way any targets for the Nifty futures or indices shown therein.
 
  Please click on the table to enlarge. For more info on the above table,  please click here.

All readers are requested to read the Risk Factors, Risk Analysis, Position Limits and FAQs pages of this blog to have a reasonable understanding of the system. Please do post your suggestions and comments on how this blog can be made more useful.
 
Cheers and Prosperous Investing and Trading !!!

To access and/or download  the free online Position Limit Calculator click here.

To checkout the five year history of The Momentum Signal Spreadsheet click here
 
© 2010, momentumsignal.blogspot.com All rights reserved.

Disclaimer: No research, information or content contained herein or in the accompanied spreadsheet shall be construed as advice and is offered for information and educational purposes only. We shall not be responsible and disclaim any liability for any loss, liability, damage (whether direct or consequential) or expense of any nature whatsoever which may be suffered by the user or any third party as a result of or which may be attributable, directly or indirectly, to the use of or reliance on any information or service provided. All files/information is provided 'as is' with no warranty or guarantee as to its reliability or accuracy.

Thursday, October 28, 2010

Update on The Ultimate Momentum Signal - 28th Oct. 2010

   Derivative Expiry is Here With Us !!!


On Wednesday, Nifty futures opened lower at 6088 in tandem with the losses in the Asian markets and SGX Nifty. Even though the Nifty future tried to trade higher in the morning session, it could reach only up to 6102 and thereby it left a gap of 28 points with the last traded price  of the previous day. As pointed out many a times earlier on this blog, Nifty future normally touches the previous day's last traded value on most of the days. If the last traded price is not being touched on the next trading day, it may have some significance in finding out the immediate market direction. However, readers may note that this kind of subtle gaps have very limited value in markets in a trading range than in a trending market.  Experience shows that these kinds of gaps have sometimes indicated even trend reversals. Now back to the trading scene  seen on Wednesday. The slide from the 6102 high saw the Nifty futures breaking the many lower reference points one by one in a two way trade mode to record a low of 6005.  This low of 6005 incidentally happens  to be placed just above another minor support level at 6000. The last trade was at 6031.   

Nifty Futures - Daily Chart   


The chart above shows the rounding top reversal from the 6175 resistance levels. The present weakness assumes more significance as most international markets are also experiencing some losses and higher volatility of recently. In case the present turbulence gathers itself in to a  medium term correction  we may see the Nifty futures braking the significant support at 5940 and seeking lower levels. However, many factors   like the corporate results, expiry related movements, happenings in the international markets, RBI monetary action next week etc may decide the immediate direction of the Nifty futures. As the Nifty future is still trading inside a trading range, any kind of prediction is susceptible to become wide off the mark. Traders may expect choppy and volatile trading on Thursday. 

Last Thursday is the derivative expiry day in the Indian stock markets. Many strange price movements at the stock and market levels have been seen on the derivative expiry days, albeit occasionally.  The expiry of September month Nifty futures were at the 6030 levels. One day before the derivative expiry, the October month Nifty future contract has closed at the exactly same level. Therefore, what actually happens on this expiry day seems to be beyond anybody's guess at present. However, it seems appropriate to express another risk factor that any trading signal  indicated by the Momentum Signal system could become more error prone around the derivative expiry days and especially when the Nifty futures are trading in a range.  


Nifty Fundas
 
The trailing PE multiple of the Nifty index have been quoting above the 25 mark for some time. The 25 PE mark  can almost  be termed as the starting point of the bubble territory. However, Wednesday's  PE multiple has just fallen below the 25 mark to 24.69.
The above table shows the latest data related  to Nifty trailing valuation, sourced from the NSE, India website.  The historical  trailing price earning ( PE Ratio ), price to book value ( PB Ratio ) and dividend yield ( DY Ratio ) of the Nifty Index  were at 24.69 3.78 and 1.04 as on 27th October 2010. Readers may please note that the periods in which the Nifty index traded above a historical PE Ratio of 25 were limited to just  two occasions in the years 2000 and 2007-08. And both such periods coincided with the highs just before the burst of the then bull markets. ( More information and analysis on Nifty historical valuation is available from the "Nifty Fundas" page of this blog ).

Updated Momentum Signal Spreadsheet

The updated spreadsheet showing the Momentum Signal as at the close of the trading on  27th October, 2010 is given below :
 Nifty futures and Nifty have closed with neutral Momentum Signal values for the fourth day.


Projected Momentum Signal Close Values


The projected levels Momentum Signal values applicable to various ranges of closing values of the current month Nifty Futures, Nifty Index and the BSE Sensex,  as at the close of next trading day, ie. as on  28th October, 2010, are given in the following table. All readers are requested to take note that the table below is just a ready reckoner for the next day's Momentum Signal values and are in no way any targets for the Nifty futures or indices shown therein.

  Please click on the table to enlarge. For more info on the above table,  please click here.

All readers are requested to read the Risk Factors, Risk Analysis, Position Limits and FAQs pages of this blog to have a reasonable understanding of the system. Please do post your suggestions and comments on how this blog can be made more useful.
 
Cheers and Prosperous Investing and Trading !!!

To access and/or download  the free online Position Limit Calculator click here.

To checkout the five year history of The Momentum Signal Spreadsheet click here

 © 2010, momentumsignal.blogspot.com All rights reserved.

Disclaimer: No research, information or content contained herein or in the accompanied spreadsheet shall be construed as advice and is offered for information and educational purposes only. We shall not be responsible and disclaim any liability for any loss, liability, damage (whether direct or consequential) or expense of any nature whatsoever which may be suffered by the user or any third party as a result of or which may be attributable, directly or indirectly, to the use of or reliance on any information or service provided. All files/information is provided 'as is' with no warranty or guarantee as to its reliability or accuracy.

Wednesday, October 27, 2010

Update on The Ultimate Momentum Signal - 27th Oct. 2010

   Another Day of Choppy Trading !!! 

After considering the strength seen in the international markets, this blog had indicated  that a test of the higher resistance was possible. However, nothing of that sort happened in Tuesday's trading. By the time Nifty futures opened for trading the Asian markets were trading with mild losses. Consequently the Nifty futures opened at 6125 and immediately set the then high of 6139. It mostly traded inside the opening range of the previous  day between 6110 to 6130 till around 11.30 AM. It broke below the previous day's low of 6111 in the middle of the day to record a low of 6094 which almost coincided with the earlier indicated support range of 6083 - 6093 level. As is common in choppy markets, the recovery from this low helped Nifty futures to establish a new high for the day at 6141 at around 2.30 PM . However, the gains were not held at all and the futures revisited 6100 level within a short time. The last trade was at 6109. 


Nifty Futures - Daily Chart


The trading range seems to be confined to an area between 6050 and 6175 at present. The option open interest also indicates that the expiry settlement could be between 6000 and 6200. ( However, open interest positions are subject to change in accordance with any major changes to price. )  Traders may expect more of choppy and directionless trading till the market itself resolves the question of direction.

Even though Nifty futures traded below the previous day's low, a similar action was not seen in the chart of BSE Sensex. This could be attributed to the higher weightage of the market heavy weight Reliance stock in the Sensex. In fact the latest strength of the  market itself is due to the positive momentum seen in the Reliance stock.

BSE Sensex - Daily Chart


 All Time Highs

  
Many readers who might not have access to the historical charts might be interested in knowing the all time highs of the Indian stock market indices. The above table shows the all time highs of Nifty futures (then current month ), S&P Nifty and BSE Sensex and the dates on which the highs were recorded. The all time intraday high of Nifty future is 6336 and that of the Nifty index is 6357. The highest closing prices of futures and the index were at 6288 and 6289 respectively.
 

Nifty Fundas
 
The trailing PE multiple of the Nifty index have been quoting above the 25 mark for some time. The 25 PE mark  can almost  be termed as the starting point of the bubble territory. However, Tuesday's PE multiple has just fallen below the 25 mark to 24.98.


The above table shows the latest data related  to Nifty trailing valuation, sourced from the NSE, India website.  The historical  trailing price earning ( PE Ratio ), price to book value ( PB Ratio ) and dividend yield ( DY Ratio ) of the Nifty Index  were at 24.98, 3.82 and 1.03 as on 26th October 2010. Readers may please note that the periods in which the Nifty index traded above a historical PE Ratio of 25 were limited to just  two occasions in the years 2000 and 2007-08. And both such periods coincided with the highs just before the burst of the then bull markets. ( More information and analysis on Nifty historical valuation is available from the "Nifty Fundas" page of this blog ).


Updated Momentum Signal Spreadsheet

The updated spreadsheet showing the Momentum Signal as at the close of the trading on  26th October, 2010 is given below :


Nifty futures and Nifty have closed with neutral Momentum Signal values for the third day.


Projected Momentum Signal Close Values


The projected levels Momentum Signal values applicable to various ranges of closing values of the current month Nifty Futures, Nifty Index and the BSE Sensex,  as at the close of next trading day, ie. as on  27h October, 2010, are given in the following table. All readers are requested to take note that the table below is just a ready reckoner for the next day's Momentum Signal values and are in no way any targets for the Nifty futures or indices shown therein.
 
  Please click on the table to enlarge. For more info on the above table,  please click here.

All readers are requested to read the Risk Factors, Risk Analysis, Position Limits and FAQs pages of this blog to have a reasonable understanding of the system. Please do post your suggestions and comments on how this blog can be made more useful.
 
Cheers and Prosperous Investing and Trading !!!

To access and/or download  the free online Position Limit Calculator click here.

To checkout the five year history of The Momentum Signal Spreadsheet click here
 
© 2010, momentumsignal.blogspot.com All rights reserved.

Disclaimer: No research, information or content contained herein or in the accompanied spreadsheet shall be construed as advice and is offered for information and educational purposes only. We shall not be responsible and disclaim any liability for any loss, liability, damage (whether direct or consequential) or expense of any nature whatsoever which may be suffered by the user or any third party as a result of or which may be attributable, directly or indirectly, to the use of or reliance on any information or service provided. All files/information is provided 'as is' with no warranty or guarantee as to its reliability or accuracy.

Tuesday, October 26, 2010

Update on The Ultimate Momentum Signal - 26th Oct. 2010

  Another Test of the Resistances Ahead ???
 
Nifty futures opened some 30 points higher at 6120 on Monday. The opening range was between 6130 and 6111, of which the latter became the day's low. The rally from the low saw the Nifty futures piecing the 6150 - 6152 highs of the previous two trading days. However, the breakout above the two day highs stalled at 6180, which almost coincided with the top end of immediate resistance zone indicated in the previous post between 6150 and 6175. The Nifty futures spent significant time trading above the 6150 mark in the morning session but later started to trade lower and tested the open at 6120 two or three times. The test of 6120 seemed to be a simple test of the lower end of the range as part of the expected choppy trade and no significant selling pressure was seen as such. Therefore,  Nifty futures recovered from the 6120 level and finally closed at 6137.


Nifty Futures - Daily Chart


Monday's trading has again lead to a candle with a tail on top indicating resistance at 6175 level. However, as already stated there was not much selling pressure seen when the Nifty futures tested the lower ranges today.  The only other emerging market which appeared to be correcting in tandem with the Indian stock market, the Taiwanese market has rallied as on Monday to test the recent high. Most of the major international markets barring the Japanese one are all in medium term uptrend and are very near to their 2010 year highs. It is also reported that emerging market funds collected a staggering 4.7 billion US Dollars in last week. Therefore, the source of cheap money  seems to be continuing without any hindrance, aided by the expected Fed action of further monetary expansion. Any further buying spree by the FIIs could trigger a short covering rally which may retest the higher resistances. Traders may again lookout for the market action around the 6175 levels for understanding the market direction. A breakout above this level may see Nifty futures testing the 5230 to 5250 levels initially as stated already in the previous two posts.  In case the futures trades below the Monday's low, it may get immediate support between 6050 to 6080 levels.


 All Time Highs

  
Many readers who might not have access to the historical charts might be interested in knowing the all time highs of the Indian stock market indices. The above table shows the all time highs of Nifty futures (then current month ), S&P Nifty and BSE Sensex and the dates on which the highs were recorded. The all time intraday high of Nifty future is 6336 and that of the Nifty index is 6357. The highest closing prices of futures and the index were at 6288 and 6289 respectively.
 
Nifty Fundas
 
The trailing PE multiple of the Nifty index have again started hover above the 25 mark. The 25 PE mark  can almost  be termed as the starting point of the bubble territory.
 
 
The above table shows the latest data related  to Nifty trailing valuation, sourced from the NSE, India website.  The historical  trailing price earning ( PE Ratio ), price to book value ( PB Ratio ) and dividend yield ( DY Ratio ) of the Nifty Index  were at 25.2, 3.84 and 1.03 as on 25th October 2010. Readers may please note that the periods in which the Nifty index traded above a historical PE Ratio of 25 were limited to just  two occasions in the years 2000 and 2007-08. And both such periods coincided with the highs just before the burst of the then bull markets. ( More information and analysis on Nifty historical valuation is available from the "Nifty Fundas" page of this blog ).

Updated Momentum Signal Spreadsheet

The updated spreadsheet showing the Momentum Signal as at the close of the trading on  25th October, 2010 is given below :


 The Momentum Signal has again indicated neutral values for the Monday's close values.


Projected Momentum Signal Close Values


The projected levels Momentum Signal values applicable to various ranges of closing values of the current month Nifty Futures, Nifty Index and the BSE Sensex,  as at the close of next trading day, ie. as on  26th October, 2010, are given in the following table. All readers are requested to take note that the table below is just a ready reckoner for the next day's Momentum Signal values and are in no way any targets for the Nifty futures or indices shown therein.
 
 
  Please click on the table to enlarge. For more info on the above table,  please click here.

All readers are requested to read the Risk Factors, Risk Analysis, Position Limits and FAQs pages of this blog to have a reasonable understanding of the system. Please do post your suggestions and comments on how this blog can be made more useful.
 
Cheers and Prosperous Investing and Trading !!!

To access and/or download  the free online Position Limit Calculator click here.

To checkout the five year history of The Momentum Signal Spreadsheet click here
 
© 2010, momentumsignal.blogspot.com All rights reserved.

Disclaimer: No research, information or content contained herein or in the accompanied spreadsheet shall be construed as advice and is offered for information and educational purposes only. We shall not be responsible and disclaim any liability for any loss, liability, damage (whether direct or consequential) or expense of any nature whatsoever which may be suffered by the user or any third party as a result of or which may be attributable, directly or indirectly, to the use of or reliance on any information or service provided. All files/information is provided 'as is' with no warranty or guarantee as to its reliability or accuracy.

Sunday, October 24, 2010

Update on The Ultimate Momentum Signal - 25th Oct. 2010

      Bumpy Ride Ahead ???

Last Friday, Nifty futures opened at 6140 and didn't trade above the previous day's high of 6152 and thus paving the way for a revisit of the lower support levels. It means that the area  between 6150 to 6175 remains as a resistance for the time being. On the way down the futures pierced the indicated support of 6083 to record a low of 6058 on Friday. However, the futures recovered and closed at 6089 , which was just above the support area of 6083. As the market has traded through the 6083 support area many times by now, the significance of this support / resistance seems to have lost to some extent. 

Nifty Futures - Daily Chart


The recovery seen so far could either be a part of another leg of an up move or a temporary recovery which may normally occur in any downtrend. The immediate direction of the market seems to be elusive at the best. The impending derivative expiry on Thursday and a heavy dose of derivative positions may make the trading scene very choppy and volatile. More of quarterly results will add to stock specific volatility too. The saving grace seems to be strength seen of late in the international equity markets. However the international market's reaction to the call to avoid competitive currency devaluation made at the G 20 meet and whether the call will have any effect on the ground  remains to be seen at present. In case of an up move, traders may watch out for the markets reaction at 6150 to 6175 resistance levels. If the Nifty future breaks the said resistance, it may revisit the 6230 - 6250 area. And in case the futures remains below the 6083 to 6093 area, it may revisit the 6000 support area. However, traders may expect higher uncertainty at these levels because of  the added instability due to the derivative expiry and release of more corporate results.   

Nifty Index - Weekly Chart


The weekly chart of the Nifty index shows three red candles in a row. The last candle's tail is placed at the bottom indicating a support at the lower level. However, the previous two candles had thier long tails placed at the top end indicating selling and resistance at higher levels. The only conclusion which can be made from  the chart above is that the medium term uptrend is pausing at present and a reversal  of medium term trend  as  indicated by a lower low and a lower high has not yet occurred. The indications are for further choppy and volatile trading till the market direction makes it self seen on charts.


 All Time Highs

  
Many readers who might not have access to the historical charts might be interested in knowing the all time highs of the Indian stock market indices. The above table shows the all time highs of Nifty futures (then current month ), S&P Nifty and BSE Sensex and the dates on which the highs were recorded. The all time intraday high of Nifty future is 6336 and that of the Nifty index is 6357. The highest closing prices of futures and the index were at 6288 and 6289 respectively.
Nifty Fundas

Together with the strong rally and non-stop gains in the broader markets seen till recently, the trailing valuations levels of the Nifty index have again started hover above the 25 mark. The 25 PE mark  can almost  be termed as the starting point of the bubble territory.
The above table shows the latest data related  to Nifty trailing valuation, sourced from the NSE, India website.  The historical  trailing price earning ( PE Ratio ), price to book value ( PB Ratio ) and dividend yield ( DY Ratio ) of the Nifty Index  were at 25.03, 3.82 and 1.03 as on 22nd October 2010. Readers may please note that the periods in which the Nifty index traded above a historical PE Ratio of 25 were limited to just  two occasions in the years 2000 and 2007-08. And both such periods coincided with the highs just before the burst of the then bull markets. ( More information and analysis on Nifty historical valuation is available from the "Nifty Fundas" page of this blog ).


Updated Momentum Signal Spreadsheet

The updated spreadsheet showing the Momentum Signal as at the close of the trading on  22nd October, 2010 is given below :
The Momentum Signal has indicated neutral values for the last Friday's close values.


Projected Momentum Signal Close Values


The projected levels Momentum Signal values applicable to various ranges of closing values of the current month Nifty Futures, Nifty Index and the BSE Sensex,  as at the close of next trading day, ie. as on  25th October, 2010, are given in the following table. All readers are requested to take note that the table below is just a ready reckoner for the next day's Momentum Signal values and are in no way any targets for the Nifty futures or indices shown therein.


  Please click on the table to enlarge. For more info on the above table,  please click here.

All readers are requested to read the Risk Factors, Risk Analysis, Position Limits and FAQs pages of this blog to have a reasonable understanding of the system. Please do post your suggestions and comments on how this blog can be made more useful.
 
Cheers and Prosperous Investing and Trading !!!

To access and/or download  the free online Position Limit Calculator click here.

To checkout the five year history of The Momentum Signal Spreadsheet click here

© 2010, momentumsignal.blogspot.com All rights reserved.

Disclaimer: No research, information or content contained herein or in the accompanied spreadsheet shall be construed as advice and is offered for information and educational purposes only. We shall not be responsible and disclaim any liability for any loss, liability, damage (whether direct or consequential) or expense of any nature whatsoever which may be suffered by the user or any third party as a result of or which may be attributable, directly or indirectly, to the use of or reliance on any information or service provided. All files/information is provided 'as is' with no warranty or guarantee as to its reliability or accuracy.

Friday, October 22, 2010

Update on The Ultimate Momentum Signal - 22nd Oct. 2010

     The Test of the 6083 Resistance Succeeds  !!!

Due to the constraint of time, this post will be a short one. Please bear with me.

  • As expected the Nifty futures tried to test the resistance at 6083.
  • It has succeeded to break the resistance at 6083.
  • The resistance at 6083 may act as a support for now.
  • The next resistance remains at 6175.
  • If this is taken out, we may see the test of  resistance at 6230 to 6250 levels.
  • There are still chances for the formation of a lower low.
  • The wide range for Friday could be anywhere between 6083 to 6230.
Nifty Futures - Daily Chart


 All Time Highs

  
Many readers who might not have access to the historical charts might be interested in knowing the all time highs of the Indian stock market indices. The above table shows the all time highs of Nifty futures (then current month ), S&P Nifty and BSE Sensex and the dates on which the highs were recorded. The all time intraday high of Nifty future is 6336 and that of the Nifty index is 6357. The highest closing prices of futures and the index were at 6288 and 6289 respectively.
Nifty Fundas

Together with the strong rally and non stop gains in the broader markets seen till recently, the trailing valuations levels of the Nifty index have again started hover above the 25 mark. The 25 PE mark  can almost  be termed as the starting point of the bubble territory.
The above table shows the latest data related  to Nifty trailing valuation, sourced from the NSE, India website.  The historical  trailing price earning ( PE Ratio ), price to book value ( PB Ratio ) and dividend yield ( DY Ratio ) of the Nifty Index  were at 25.18, 3.84 and 1.03 as on 21st October 2010. Readers may please note that the periods in which the Nifty index traded above a historical PE Ratio of 25 were limited to just  two occasions in the years 2000 and 2007-08. And both such periods coincided with the highs just before the burst of the then bull markets. ( More information and analysis on Nifty historical valuation is available from the "Nifty Fundas" page of this blog ).

This information is being provided for the benefit of long term investors only. For traders, they can enjoy the rally till it lasts. It may be noted that markets can remain overvalued and overbought for significant periods  which can be much beyond our expectations. 
Updated Momentum Signal Spreadsheet

The updated spreadsheet showing the Momentum Signal as at the close of the trading on  21st October, 2010 is given below :
 
In spite of the rally the Momentum Signal has indicated a -80 value.
Projected Momentum Signal Close Values


The projected levels Momentum Signal values applicable to various ranges of closing values of the current month Nifty Futures, Nifty Index and the BSE Sensex,  as at the close of next trading day, ie. as on  22nd October, 2010, are given in the following table.

  Please click on the table to enlarge. For more info on the above table,  please click here.

All readers are requested to read the Risk Factors, Risk Analysis, Position Limits and FAQs pages of this blog to have a reasonable understanding of the system. Please do post your suggestions and comments on how this blog can be made more useful.
 
Cheers and Prosperous Investing and Trading !!!

To access and/or download  the free online Position Limit Calculator click here.

To checkout the five year history of The Momentum Signal Spreadsheet click here
© 2010, momentumsignal.blogspot.com All rights reserved.

Disclaimer: No research, information or content contained herein or in the accompanied spreadsheet shall be construed as advice and is offered for information and educational purposes only. We shall not be responsible and disclaim any liability for any loss, liability, damage (whether direct or consequential) or expense of any nature whatsoever which may be suffered by the user or any third party as a result of or which may be attributable, directly or indirectly, to the use of or reliance on any information or service provided. All files/information is provided 'as is' with no warranty or guarantee as to its reliability or accuracy.

Thursday, October 21, 2010

Update on The Ultimate Momentum Signal - 21st Oct. 2010

    The Support at 6000 Broken or Not ???

After a day of almost random and wild movements in the Nifty futures, one wonders what really happened during the day and why ? Yours truly is at a loss to explain the dramatic kind of movements seen in the Nifty futures on Wednesday.  If we are not sure about what exactly happened during the day, lets observe it somewhat objectively and see  what comes out of it !
Nifty futures opened  at 6018, slightly lower than the previous day's last traded price of 6025. It immediately recorded the day's then low of 6010, which was slightly higher than  the Monday's  low of 6008. From thereon, the recovery rally started and Nifty futures recorded a high of 6068 in the morning session itself. Most of the trading till  the 2.00 PM mark was confined to a narrow range of 30 points between 6030 and 6060.  The trading remained very choppy and directionless. Just after the 2.00 PM mark, a sudden rally in the markets saw the futures recording a new daily high of 6077. ( This high incidentally remains just below the 6083 resistance mark indicated in the previous post. ) This new high actually took out the stops placed above the morning's high. What happened afterward is even strange. Nifty futures took out the stops at the then day's low and the 6000 levels too in a swift movement in the last half an hour of trading. It recorded a new daily low of 5987 but recovered immediately to close at 6015. Now the pertinent question is whether the support at the 6000 level still holds. The answer seems to be an 'yes'.

Nifty Futures - Daily Chart   

     
The above chart shows that after a correction lasting almost five trading days, which includes the day on which the high was recorded, a doji candle seen in the chart. The kind of trading was also random and directionless making the doji candle more meaningful. A doji candle ( a candle in which  the open and close are very near ) indicates indecision by the markets. A doji candle after a big move may indicate a pause or even a change of direction. As such the market may move in either direction from hereon but the chances of a recovery seemed to be higher. However, traders may not rule out  the fact that market may retrace the correction once again after a recovery lasting a few trading sessions. 

The open interest in the three near month contracts of Nifty futures increased by 8.83 lakhs on Wednesday. Significant addition of open interest in the Nifty call options were also seen  at the three strikes at 6000, 6100 and 6200 levels. However, open interest in the Nifty puts were seen decreasing except at the 5800 strike. All the above data actually adds up only to increase the confusion in the analysis to find the immediate market direction. As the US markets are seen rallying overnight, Nifty future may recover and try to test the 6083 resistance on Thursday.

 All Time Highs


Many readers who might not have access to the historical charts might be interested in knowing the all time highs of the Indian stock market indices. The above table shows the all time highs of Nifty futures (then current month ), S&P Nifty and BSE Sensex and the dates on which the highs were recorded. The all time intraday high of Nifty future is 6336 and that of the Nifty index is 6357. The highest closing prices of futures and the index were at 6288 and 6289 respectively.
 
Nifty Fundas

Together with the strong rally and non stop gains in the broader markets seen till recently, the trailing valuations levels of the Nifty index were hovering above the 25 mark till just two days ago. The 25 PE mark  can almost  be termed as the starting point of the bubble territory.


The above table shows the latest data related  to Nifty trailing valuation, sourced from the NSE, India website.  The historical  trailing price earning ( PE Ratio ), price to book value ( PB Ratio ) and dividend yield ( DY Ratio ) of the Nifty Index  were at 24.69, 3.76 and 1.05 as on 20th October 2010. Readers may please note that the periods in which the Nifty index traded above a historical PE Ratio of 25 were limited to just  two occasions in the years 2000 and 2007-08. And both such periods coincided with the highs just before the burst of the then bull markets. ( More information and analysis on Nifty historical valuation is available from the "Nifty Fundas" page of this blog ).

This information is being provided for the benefit of long term investors only. For traders, they can enjoy the rally till it lasts. It may be noted that markets can remain overvalued and overbought for significant periods  which can be much beyond our expectations. 
 
Updated Momentum Signal Spreadsheet

The updated spreadsheet showing the Momentum Signal as at the close of the trading on  20th October, 2010 is given below :


 The Momentum Signal value for Wednesday's close remained at the -100 levels.

Projected Momentum Signal Close Values


The projected levels Momentum Signal values applicable to various ranges of closing values of the current month Nifty Futures, Nifty Index and the BSE Sensex,  as at the close of next trading day, ie. as on  21th October, 2010, are given in the following table.
 
 
  Please click on the table to enlarge. For more info on the above table,  please click here.

All readers are requested to read the Risk Factors, Risk Analysis, Position Limits and FAQs pages of this blog to have a reasonable understanding of the system. Please do post your suggestions and comments on how this blog can be made more useful.
 
Cheers and Prosperous Investing and Trading !!!

To access and/or download  the free online Position Limit Calculator click here.

To checkout the five year history of The Momentum Signal Spreadsheet click here
 
© 2010, momentumsignal.blogspot.com All rights reserved. 

Disclaimer: No research, information or content contained herein or in the accompanied spreadsheet shall be construed as advice and is offered for information and educational purposes only. We shall not be responsible and disclaim any liability for any loss, liability, damage (whether direct or consequential) or expense of any nature whatsoever which may be suffered by the user or any third party as a result of or which may be attributable, directly or indirectly, to the use of or reliance on any information or service provided. All files/information is provided 'as is' with no warranty or guarantee as to its reliability or accuracy.