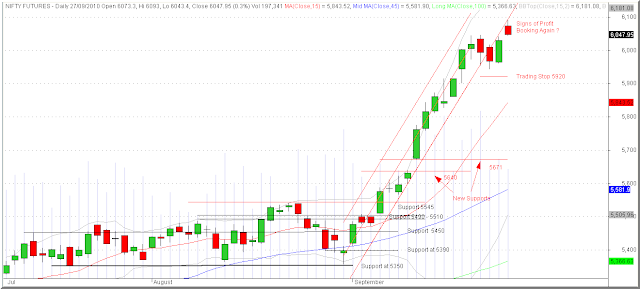
Signs of Profit Booking Again ... ?
Nifty futures opened positively with a gap at 6070 on Monday on the back of over all positive momentum . It recorded the morning session's low of 6060 at the opening minutes itself. The futures again rallied to test the highs and recorded the day's high of 6093 before noon. However, as the futures were unable to break the 6093 high, it tested the lower end of the day's trading range and to fill the opening gap. Once the 6070 mark was broken, it reached the previous rally high of 6048 with in a very short time. It rallied 15 points or so and in the the next test of the lows it even reached the Friday's high of 6043.80. It seems that some buying emerged at both these points. However, the closing was at 6048 near the lows.
Oh, What a coincidence !! Readers may remember that this blog had given 6090 as the Monday's target for current month Nifty futures. And the Monday's high coincided with the target at 6090, being the interception point of the new daily bar and the lower boundary of the narrow regression channel. Friday's high also coincided with the lower boundary of the channel. Monday's low also coincided with the previous bar's high. ( BTW, Tuesday's interception point with the lower end of the regression channel is at 6135 levels. However, the utility of this projected level remains questionable for Tuesday's trading. )
Signs of Profit Booking ? Monday's trading has lead to some liquidation of Nifty futures positions. The combined reduction in the open interest of the two near month Nifty futures contracts amounted to 23 lakhs ( 2.3 million ) as on Monday. Many individual daily stock charts were showing red candles on Monday. The advance decline ratio also remained slightly on the negative side. All these facts are pointing towards some profit booking on Monday.
Nifty Futures - Daily Chart
The BSE Sensex chart shows a shooting star candle as on Monday. Both the charts of Nifty and it's futures are showing tails at the top indicating selling / profit booking. We may expect neutral or directionless trading on Tuesday. The highest levels of open interest positions in the current month Nifty options are at 6000 and 6100 strikes at present. These two levels may act as the support and resistance in the immediate future.
Nifty Valuations : The trailing PE multiple of Nifty index is quoting above the 25 mark. The historical price earning ( PE Ratio ), price to book value ( PB Ratio ) and dividend yield ( DY Ratio ) of the Nifty Index were at 25.48, 3.89 and 1.01 as on 27th September 2010. Readers may please note that the periods in which the Nifty index traded above a historical PE Ratio 25 are very limited and both such periods were the blow out stages of earlier bull markets. ( More information and analysis on Nifty historical valuation is available from the "Nifty Fundas" page of this blog. ) The following table shows the latest data related to Nifty historical valuations as seen from the NSE, India website.
Nifty Index - PE, PB and DY Ratios
Updated Momentum Signal Spreadsheet
The updated spreadsheet showing the Momentum Signal as at the close of the trading on 27th September, 2010 is given below :
Projected Momentum Signal Close Values
Please click on the table to enlarge. For more info on the above table, please click here.
As seen from the above table, any further correction or consolidation may lead to the Momentum Signal trading system indicating an exit of the existing long positions taken at the 5576 levels.
The trading stop for long positions under the Ultimate Momentum Signal system stands raised to 5965 ( i.e. 6093 minus 2.1 % of 6093 ). Traders may raise the trading stop to 97.9 % of the new high, as and when the market makes such new highs.
To access and/or download the free online Position Limit Calculator click here.
To checkout the five year history of The Momentum Signal Spreadsheet click here
© 2010, momentumsignal.blogspot.com All rights reserved.
Disclaimer: No research, information or content contained herein or in the accompanied spreadsheet shall be construed as advice and is offered for information purposes only. We shall not be responsible and disclaim any liability for any loss, liability, damage (whether direct or consequential) or expense of any nature whatsoever which may be suffered by the user or any third party as a result of or which may be attributable, directly or indirectly, to the use of or reliance on any information or service provided. All files/information is provided 'as is' with no warranty or guarantee as to its reliability or accuracy.


No comments:
Post a Comment