Another Higher Open and A Lower Close ... !!!
The Nifty futures opened near the day's highs on Monday and as usual it started it's slow downward movement right from the morning. The futures recorded a high of 5464 and a low of 5417 before closing at 5419. Here is a quote from the last post : A higher open and the slow downward trading "is becoming a common pattern of trading these days." However, a lower opening may lead to the opposite too. Following the overnight gains on Wall street, the market may trade in the positive territory on Tuesday morning and then wait for the policy action by the RBI.
Nifty Futures - Daily Chart

The Nifty futures have minor support at the top end of the previous narrow trading range between 5360 and 5410. However, a break of the lower end of the said narrow range may attract serious selling too.
BSE Sensex - Daily Chart

As seen in the above chart of the BSE Sensex, the last two day's trading has lead to the formation of doji star candles indicating selling at the higher levels. According to the Momentum Signal system, the Sensex has closed in the neutral area as on Monday. However, the Sensex and the Nifty are still trading above their short term support levels.
Tuesday will also see the interest rate hikes by the RBI. A 0.25 to 0.50 % hike in the repo rate, especially the former, seems to have been discounted by the market. A 0.25 % hike may be expected in the reverse repo too. However, it seems that the market has not yet discounted any hikes in the cash reserve ratio. The RBI has been following a soft money policy so far, in spite of the high rates of inflation these days, may be because of the political pressures. The last hikes have not been effective at all in dealing with the inflationary pressures. And the RBI has fallen behind the curve too as the real rates of interest ( Inflation - Interest ) for borrowers these days have become negative for some time.
World Markets
Some emerging markets are also trading strong alongside the Indian markets. Now, some analysts may again bring out the age old decoupling theory to justify the high valuations of the Indian markets.
In case readers are interested in the topic of the decoupling theory, click here to read the article "Risk of full-fledged crash continues to grow" published by the Economic Times.
Even if the crash envisaged in the article does not materialize at all, the western economies seem to be set for a long period of slow jobless growth.
The European stock indices, FTSE, CAC and DAX closed in the positive territory on Monday, with gains of 0.72, 0.81 and 0.45 percents respectively. The US market indices closed with strong gains of 0.97 to 1.19 percents on Monday, on the back of better than expected new home sales data. The more important point to be noted here is that the US indices have closed in the positive territory by the year to date yardstick. The CBOE VIX index also closed at 22.73, below it's 200 day moving average placed at 23.38, for the first time in two and a half months.
Updated Momentum Signal Spreadsheet
The updated spreadsheet showing the Momentum Signal as on the close of 26th July 2010, is given below.
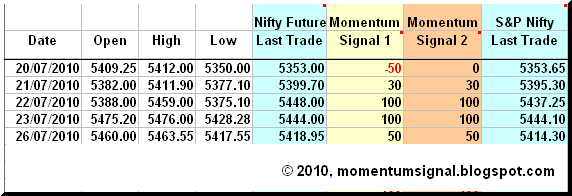
Even though the future as well as the index closed near the lows of the day, both of them were able to close in an area which still retained a +50 value of the Momentum Signal.
Projected Momentum Signal Close Values
The projected levels of closing values corresponding to the momentum shift / neutrality / continuation as on the close of trading on 27th July, 2010 are given in the table below. The table also include the projected closing values of BSE Sensex corresponding to the momentum shift / neutrality / continuation signals.

Please click on the table to enlarge. For more info on the above table, please click here.
The trailing stop for all long positions remains at 5360 which is 2.1 % away from the new high. A close below 5352 will lead to the Momentum Signal indicating a sell as on Tuesday.
As the Momentum Signal is primarily a trend following system, it may indicate whipsaw signals in range bound markets. As such, all readers of this blog are requested to read the various pages describing the system and understand all the intricacies of trading the Momentum Signal and it's risk factors too. Please do write in your comments and suggestions.
Cheers and Prosperous Investing and Trading !!!
To access and/or download the free online Position Limit Calculator click here.
To checkout the five year history of The Momentum Signal Spreadsheet click here.
To access and/or download the free online Position Limit Calculator click here.
To checkout the five year history of The Momentum Signal Spreadsheet click here.
© 2010, momentumsignal.blogspot.com All rights reserved.
Disclaimer: No research, information or content contained herein or in the accompanied spreadsheet shall be construed as advice and is offered for information purposes only. We shall not be responsible and disclaim any liability for any loss, liability, damage (whether direct or consequential) or expense of any nature whatsoever which may be suffered by the user or any third party as a result of or which may be attributable, directly or indirectly, to the use of or reliance on any information or service provided. All files/information is provided 'as is' with no warranty or guarantee as to its reliability or accuracy.
No comments:
Post a Comment