The Greek Tragedy - Act II Over...?
The Nifty Futures opened 10 points higher at 5233.30 and traded in a very narrow range of 32 points on the derivative settlement day on Thursday. The Current month futures closed at the top end of the range at 5254. The May futures were quoting at a discount of 8 to 10 points, indicating higher quantity of short positions being carried forward. The existing short positions ended up in marginal losses.
Nifty Futures - Daily Chart

The next resistance for the futures is at the lower end of the Wednesday's gap at 5277. Above that, the low of Tuesday, that is 5300 may also act as a resistance being the top end of the gap. Other resistance lines can be seen on the above chart.
World Markets
Expecting a fast agreement between the EU and IMF for a temporary solution to the Greek debt problem , the European markets closed in the green on Thursday. At the time of compiling this post ( 10.30 PM, IST ), the US markets were rallying on the news of higher corporate profitability and the fall in the jobless claim numbers. The S&P 500 index was trading above it's 15 DMA and the CBOE VIX has fallen to the 18 to 18.5 range.
US S&P 500 Index & CBOE VIX Daily Chart

The Updated Momentum Signal Spreadsheet
The updated spreadsheet showing the Momentum Signal as on the close of 29th April 2010, is given below.

The Momentum Signal has closed in the sell territory for the second day.
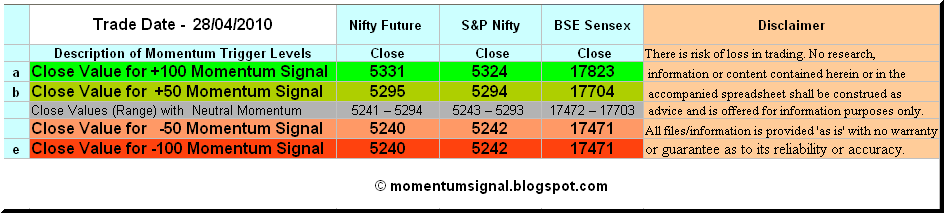
Projected Momentum Signal Close Values
The projected levels of closing values corresponding to the momentum shift / neutrality / continuation as on the close of trading on 30th April, 2010 are given in the table below. The table also include the projected closing values of BSE Sensex corresponding to the momentum shift / neutrality / continuation signals.

You can click on the table to enlarge. For more info on the above table, please click here.
Please do write in your suggestions and comments about this blog.
Cheers and Prosperous Investing and Trading!!!
You can use the free online Position Limit Calculator from here.
You can also checkout the five year history of The Momentum Signal Spreadsheet from here.
You can also checkout the five year history of The Momentum Signal Spreadsheet from here.
Disclaimer: No research, information or content contained herein or in the accompanied spreadsheet shall be construed as advice and is offered for information purposes only. We shall not be responsible and disclaim any liability for any loss, liability, damage (whether direct or consequential) or expense of any nature whatsoever which may be suffered by the user or any third party as a result of or which may be attributable, directly or indirectly, to the use of or reliance on any information or service provided. All files/information is provided 'as is' with no warranty or guarantee as to its reliability or accuracy.